Track your account’s performance
You can read your account’s health in about a minute — followers, engagement, and what changed — without opening another analytics tool. It all lives in your Overview, and your Director can explain any number in plain words.
Open your Overview
- Go to your dashboard.
- Find your brand’s profile picture in the top bar.
- Click Overview next to it.
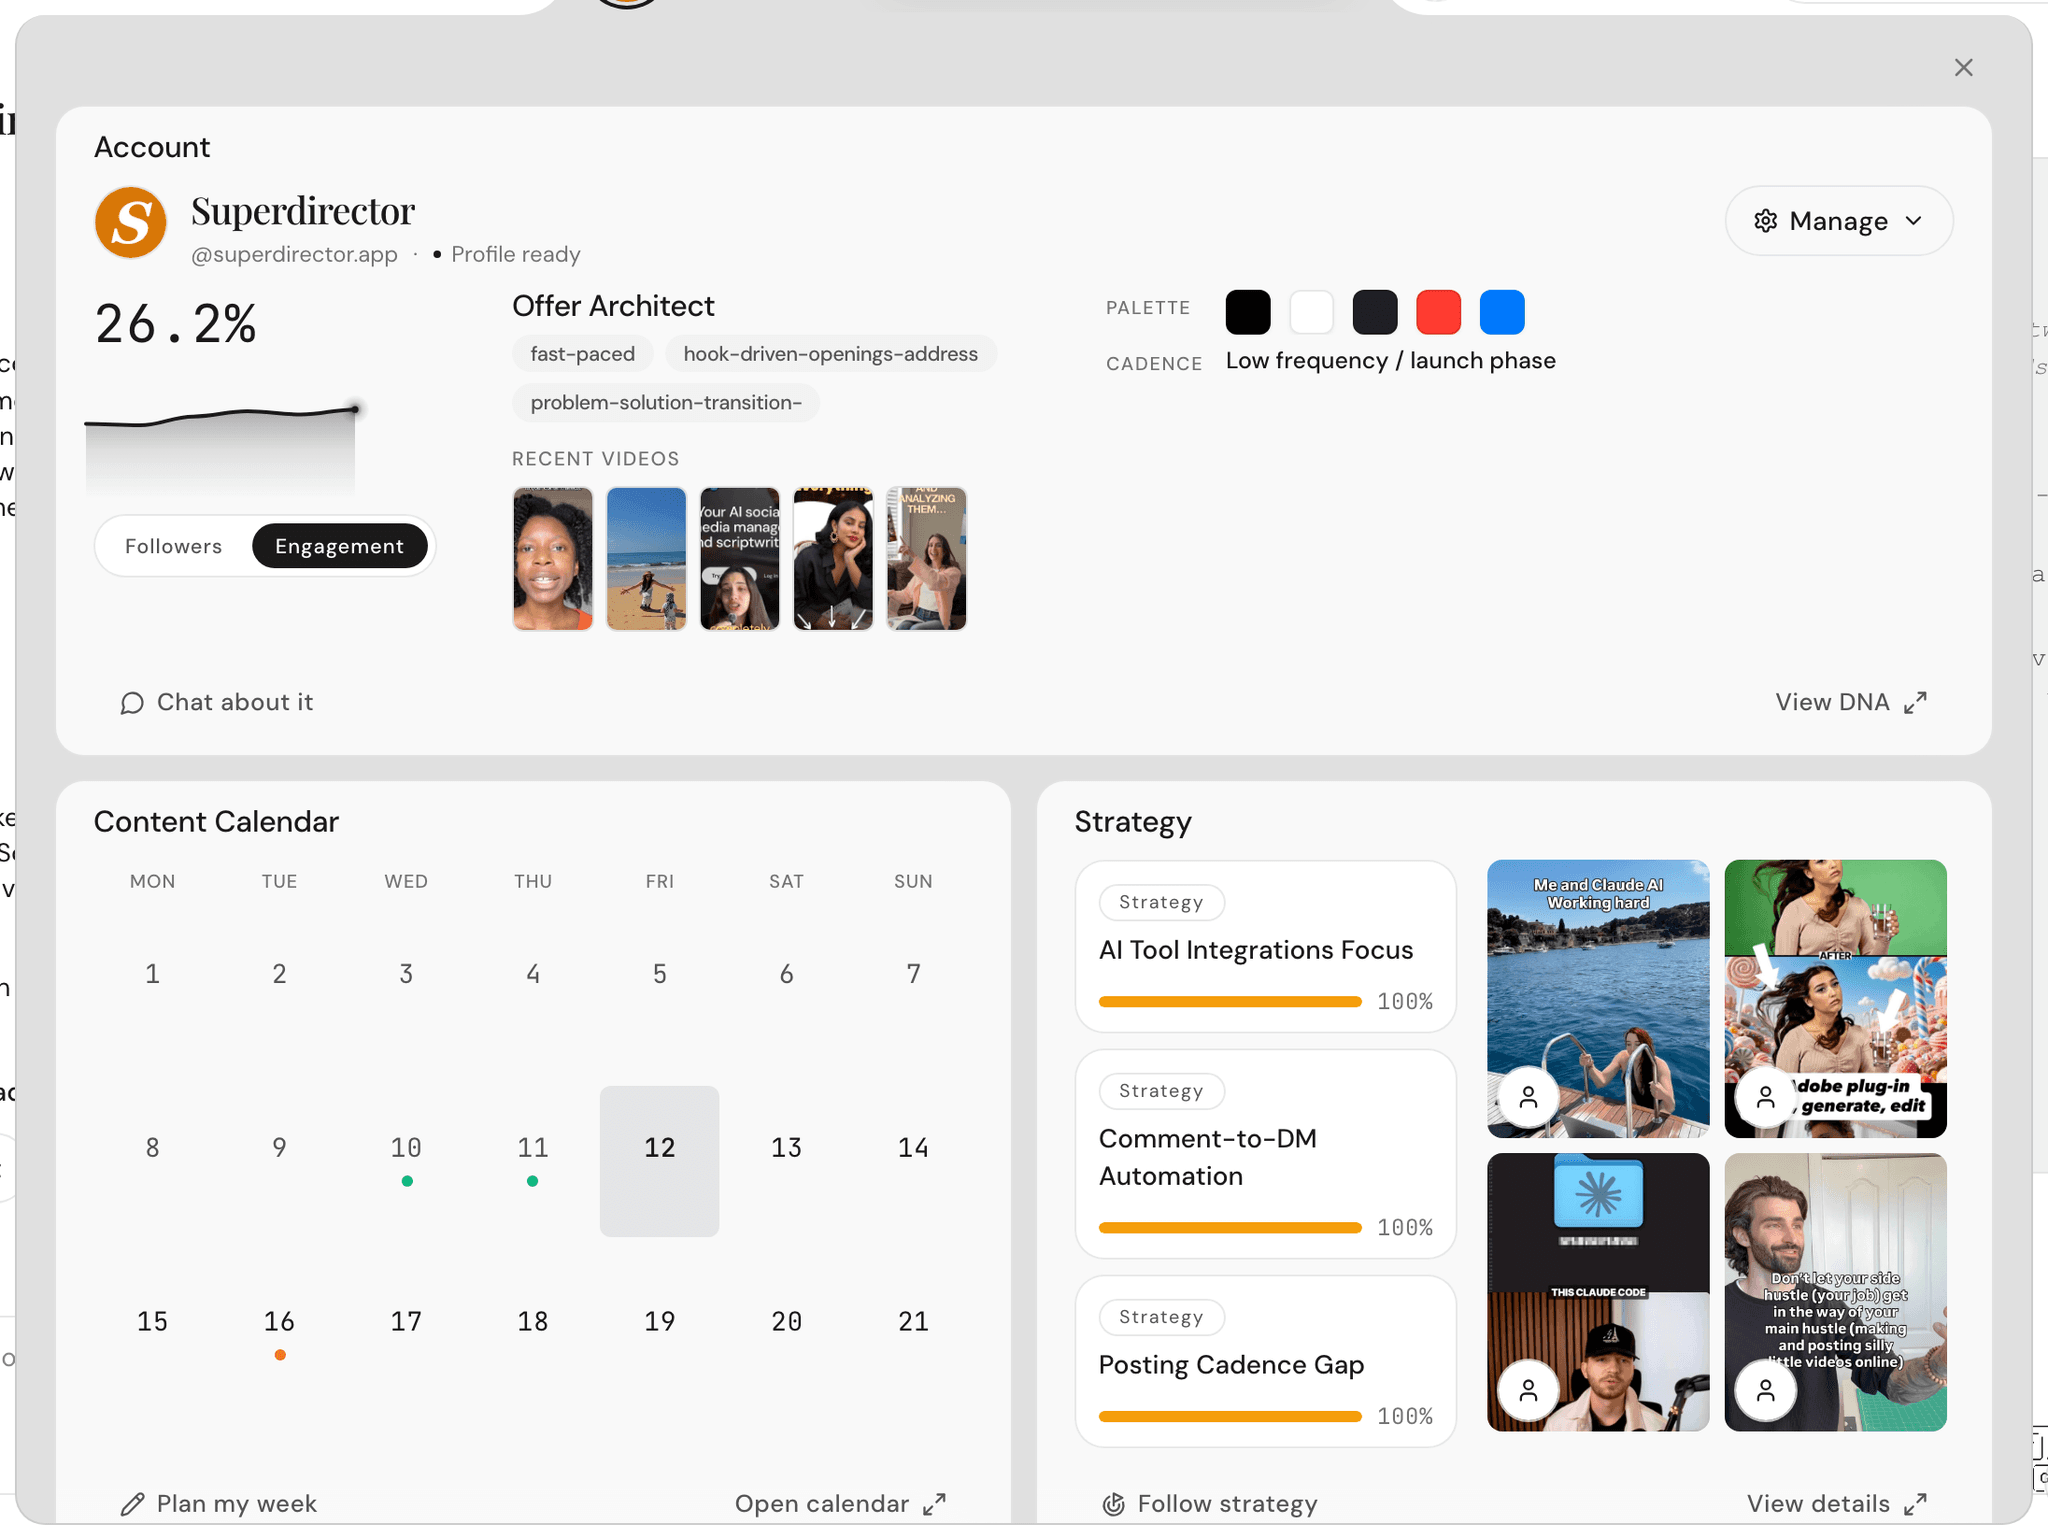
The Overview opens right below the top bar. Click Overview again to close it.
Followers and engagement, explained in one minute
The Account card leads with your follower count, a small +/- pill showing the change since the last check, and a trend line. A short label sums up the direction — "Holding steady," "Steady growth," "Slight dip" — so you don’t have to squint at the curve.
Under the trend line, two small buttons switch the headline number: Followers and Engagement. Click Engagement to see your engagement rate instead. If your account was added recently, you may see "No engagement data yet" — that fills in as your Director gathers more of your posts.
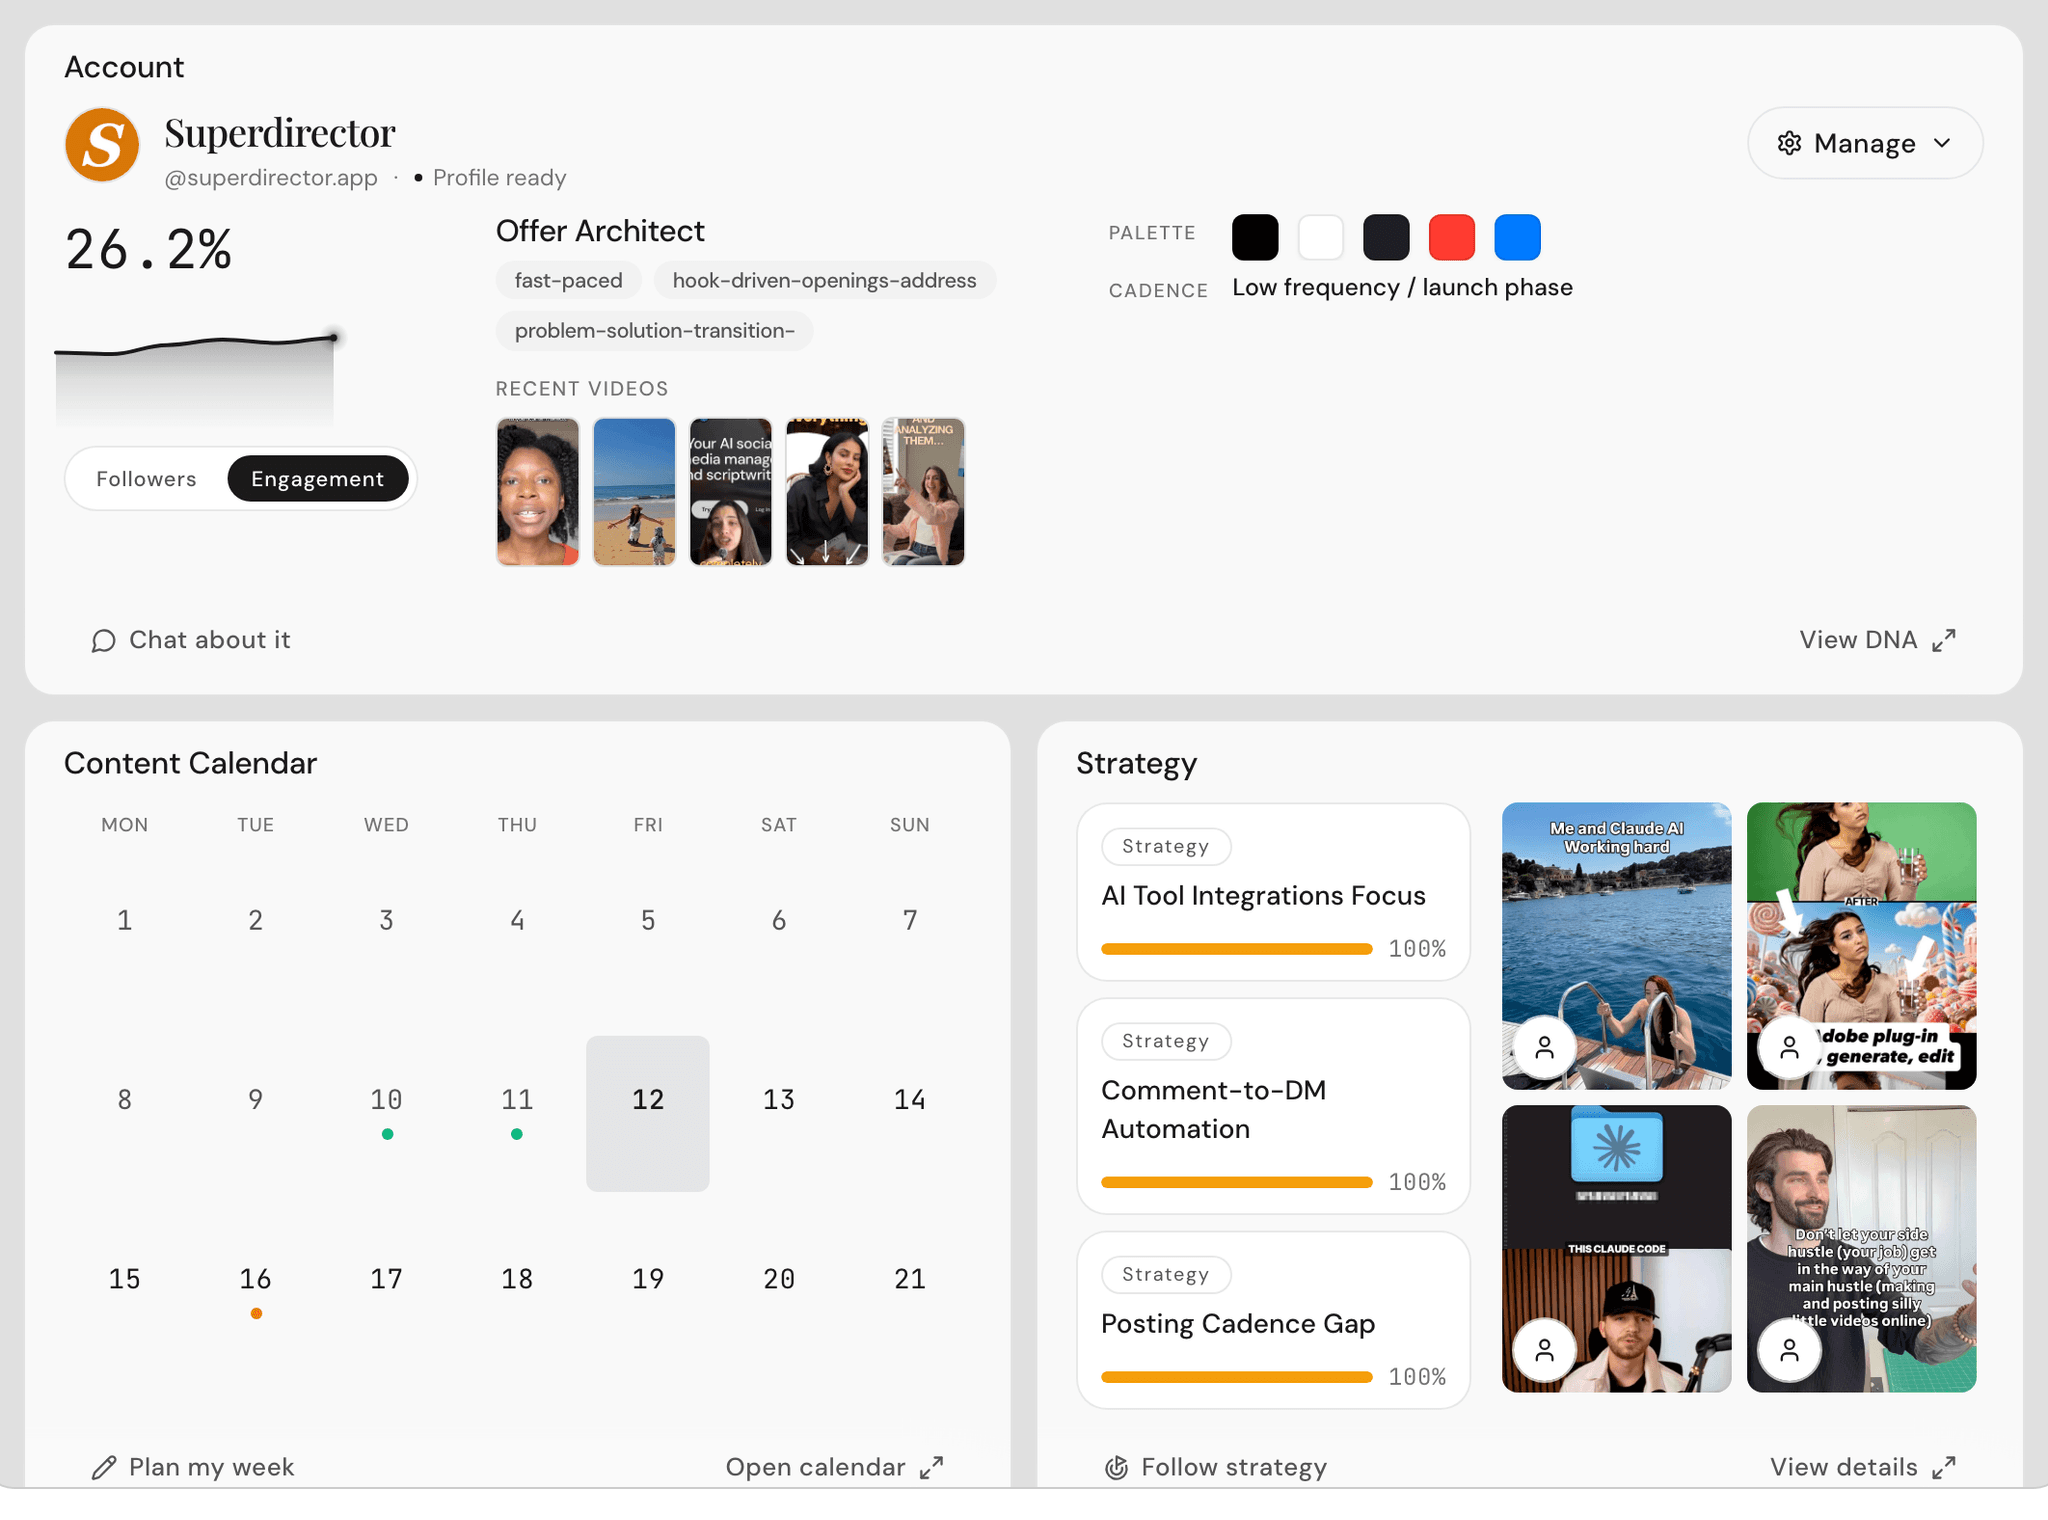
The right side of the card shows your Brand DNA summary and a Recent videos strip of your latest published posts — click any thumbnail to open the original.
Your daily insight: what changed and what to do about it
Your Director checks your account every day and writes up what it noticed: which videos moved, what your numbers did, and what’s worth acting on. Each insight comes with recommended actions and a priority, so you know what matters first.
Want a fresh pass right now? On the Account card, click the Manage button and choose Refresh daily insights. You can also just ask in chat — "what changed since yesterday?" brings back a What changed card with the day’s movement. More on reading that card in Keep an eye on competitors.
Ask the Director about your numbers
Numbers are faster to read when someone explains them. Two easy ways to ask:
- On the Account card, click Chat about it. A new conversation opens with a ready-made question in the message box — press send.
- Or just type your own question in any chat, like "how did this week go?"
Your Director answers with a Performance card: headline metric tiles, a views trend, and your Top videos. Click a top video to open its full breakdown.
What "engagement rate" means here
Engagement rate is likes plus comments, divided by views — so 5% means about 1 in 20 viewers reacted. It’s the best quick signal of whether your content lands, because views can spike for reasons that have nothing to do with your audience caring.
When the numbers point to a change worth making, your Brand DNA and weekly plan are the places to act — see Your Brand DNA and Plan your content week.