How-To Guide
Which result from a past creator campaign should become the next brief’s hypothesis?
Pull two owned campaign records, grade their measurement, compare them and carry one learning into the next brief as a hypothesis with its limits.
By the Superdirector editorial team. Google Analytics and TikTok pages reviewed October 30, 2026.
At a glance
Which result from a past creator campaign should become the next brief’s hypothesis?
Choose a learning that two of your own campaign records both support, where the measurement behind each result is sound and you can name everything that differed between the campaigns. Write it as an if-then hypothesis with a metric, a window and a statement of what would prove it wrong, and put only that one hypothesis in the new brief. A learning from one record is allowed but must be labeled as weaker. A learning whose records disagree, or whose measurement is unknown, stays out of the brief and goes on a parked list with the reason.
- Pin each record’s goal, result, read date and source before interpreting anything.
- Grade measurement as sound, partial or unknown, and treat missing data as unknown rather than zero.
- Carry one hypothesis, hold the rest constant and park every other learning in writing.
Direct answer
Short answer: carry forward one learning that two of your own campaign records both support, and write it as a hypothesis, not as a rule. Before you pick it, do three things. First, pin each record: the goal as first written, the result as observed, the date you read it and where the number came from. Second, grade the measurement behind each result as sound, partial or unknown. Third, compare the records and list everything that differed between the two campaigns. Then write one if-then sentence with a metric, a window and a statement of what would show you wrong, put only that sentence in the new brief and park every other learning in writing.
This is for an agency or brand marketer who is starting a new creator brief and has notes, reports and opinions from earlier campaigns. The decision is narrow: which one supported learning earns a place in the next brief. It does not decide whether the earlier campaigns succeeded, whether to renew any creator, or why a campaign missed. Those questions have their own pages, named in the boundary section below.
The reason to be strict is that an intake meeting rewards the loudest memory. A past result is easy to turn into a confident instruction such as “this format works.” Two records can show that two things appeared together. They cannot, by themselves, show why. Use the blank evidence-to-hypothesis sheet, the CSV version and the decision map to keep the evidence, the grade and the hypothesis apart.
Pull two owned records and pin what each one says
Choose two earlier campaigns you own the records for. Owned means you can open the campaign file, the analytics and the agreement yourself, or you hold exports someone on your side made and can name. A client’s verbal summary or a creator’s message about how it went is a lead, not a record. Two records are the minimum this method asks for, because one record cannot show whether anything repeats. If you only have one, continue, but label the outcome a single-record learning at the end.
For each record, write six things on the sheet. The goal as first written, copied from the brief or goal decision, not remembered. The result as observed: the number or the plain statement, with the unit and the counting rule. The read date, with a time zone if the report uses one. The source: which report, property or export, and who pulled it. The deliverable and platform: what was posted, where and when. And the product and offer as they stood during the campaign, including the product version if that was different from today’s. If the goal was never written, record that as a fact. Do not write one now and pretend it was the original.
Pull the data early, because old data can become harder to reach. Google’s Analytics documentation says event data in a standard property can be set to 2 months or 14 months (longer periods are for Analytics 360 only), and that the setting affects explorations and funnel reports but not standard aggregated reports. Google Analytics Help: data retention. That tells you to export the evidence you need for a comparison while you can still reach it, and to note which kind of report each number came from. It does not tell you how long your own property keeps data, because that depends on a setting somebody on your side chose. Check the setting instead of assuming it.
Keep the result in the words of the record. “Recorded visits from the tagged link: as shown in the report on that date” is a result. “The campaign did well” is a judgment, and it belongs in a different column. If your earlier goal and the conversion event were never defined, the conversion event guide explains why that will limit what the record can support.
Grade the measurement behind each result
Give each result one grade before you compare anything: sound, partial or unknown. Sound means you can say how the number was counted, that the counting was in place for the whole campaign window and that nothing you know of broke it. Partial means some of that is true: for example, tracking worked for one platform but not another, or the link changed halfway through. Unknown means you cannot say. Write the reason for each grade in a sentence, so a colleague can disagree with it.
Be careful with missing data. A blank is not a zero. Google’s Analytics documentation says that data thresholds exist to prevent a viewer from inferring the identity of individual users, that cards show data only when it meets minimum aggregation thresholds, that rows with search query information may be withheld when there are too few users, and that expanding the date range may increase the number of users who triggered an event. Google Analytics Help: data thresholds. The page describes how reports behave, and it says nothing about creator campaigns in particular. What it does justify is a habit: when a number is absent or small, record whether the report may have withheld it before you treat it as a low result. The same discipline is in the missing analytics guide.
| Grade | What you can say | What it allows | What it blocks |
|---|---|---|---|
| Sound | How the number was counted, over what window, from which source | The result may support a learning | Stating more than the counting rule covers |
| Partial | Some surfaces, dates or sources were counted and others were not | The result may support a narrow learning about the counted part | Treating the uncounted part as zero or as equal to the counted part |
| Unknown | Little or nothing about how it was counted | The result may prompt a question | Using it as evidence for anything |
Also record when the result was read relative to the campaign. A number read on the day of posting and a number read weeks later may not be comparable, and the observation window guide covers how to fix a window before reading. If the two records were read on very different timetables, say so on the sheet. That alone can make a comparison partial.
Compare the records and name every difference
Now put the two records side by side. First, write the differences between the campaigns, before looking for a pattern. Typical rows are the creator or creators, the platform and format, the length and opening of the video, the offer, the product version, the destination page, the posting dates, the channel mix and anything the brief asked for that the other brief did not. Include things you think do not matter. A difference you leave off the list cannot be ruled out later.
Second, write the candidate learning in one plain sentence, such as “campaigns where the video showed X before Y had the higher recorded Z.” Then mark the direction in each record as same, opposite or one record only, and choose a status from the table. The map below shows the same decision path.
| Status | When it applies | What you do with it |
|---|---|---|
| Supported | Both records graded sound, the result points the same way in both, and the differences are all named | It may become the hypothesis |
| Single record | Only one record is sound enough, or you have only one campaign | It may become the hypothesis if the brief says it rests on one record |
| Contradicted | The records point in opposite directions | Do not carry it; keep the list of differences as a source of questions |
| Unsupported | Measurement is unknown for the result that carries the learning | Do not carry it; repair the count before the next campaign |
Be honest about what “supported” means here. It means the two records are consistent with the learning and that you found no reason to discard it. It does not mean the learning caused the result. Two campaigns will differ in more ways than any list captures, and creator posts are not controlled experiments. If a view-heavy post is the basis of your learning, ask first whether it belongs in the evidence at all, using the viral post fit guide.
If several candidate learnings emerge, write each on its own line with its own status. You will carry one. Keeping the rest visible, with their grades, is what stops the next meeting from smuggling them into the brief.
When enlarged, scroll horizontally to read the diagram.
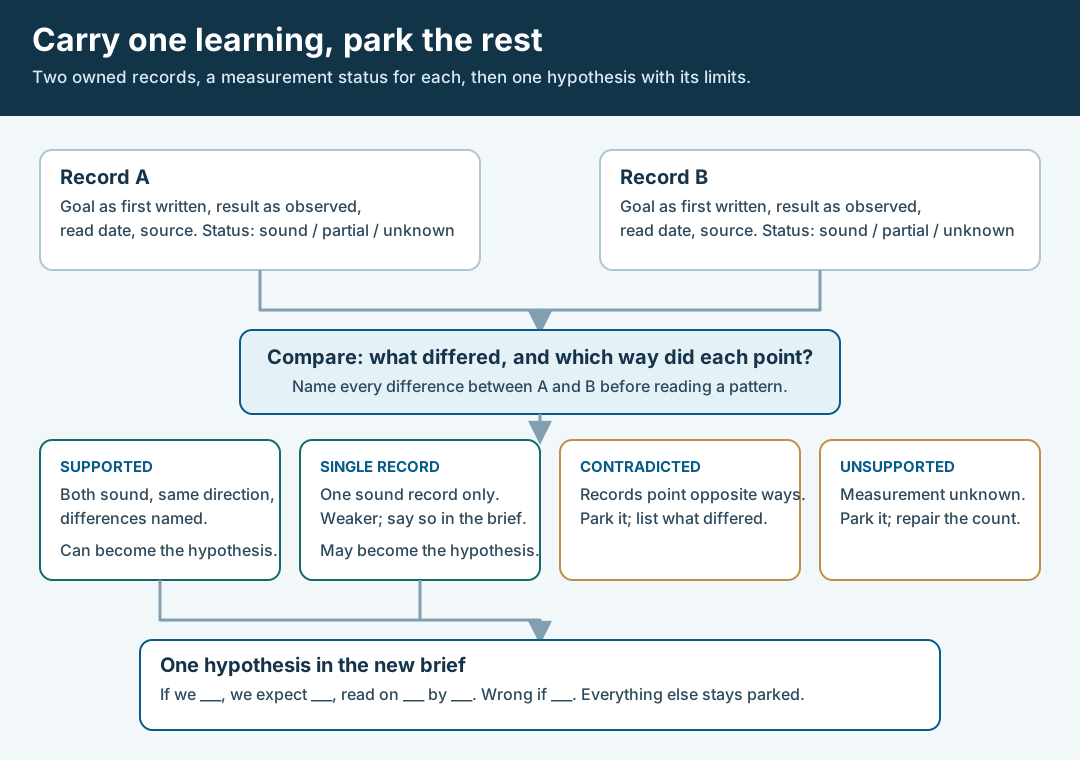
An original editorial map. Grade the measurement, compare the records, carry one hypothesis and park the rest.
Original visual by Superdirector editorial team. Creation date not recorded.
Write one learning as a hypothesis with its limits
Choose the supported learning that the next brief can actually act on, and write it as an if-then sentence: “If the new videos do X, we expect Y, read as Z over this window.” Add three more lines. The metric with its counting rule, taken from the campaign’s defined event rather than invented for the occasion. The window and read date, written now. And a wrong-if line: the result that would show the hypothesis did not hold. A hypothesis without a wrong-if line cannot lose, so it cannot teach.
Then list what stays constant and what the records cannot speak to. This is where the earlier difference list earns its place: every difference that will also vary in the new campaign is a reason the next result may not answer your question. Advertising platforms put the same idea into their own test tools. TikTok’s help page for split tests says you can select only one variable for each split test. TikTok Ads Help: split testing variables. TikTok’s marketing blog recommends using split tests to isolate one variable and creating ad groups identical except for the factor being tested. TikTok for Business: test and learn. Those pages describe paid ad-group tests, and a set of creator posts is not an ad-group split test, so read them as a design principle, not as a rule that applies to your campaign. The principle is the useful part: the fewer things that change at once, the more the result can say.
Write the limits in the same place as the hypothesis, not in a footnote. A good limit sounds like “both records come from one platform,” “the earlier product version had a different first screen,” or “one record’s link was changed halfway through.” If the limits are long, the learning is probably better as a question for the first test than as a prediction. The next-test guide shows how to write the read before launch.
Put it in the brief and park the rest in writing
Put one hypothesis in the new brief, with its status (supported or single record), its metric, window and wrong-if line. Say what the brief holds the same as the earlier campaigns and where it deliberately differs. If the brief asks the creator to do something that the learning implies, such as a particular opening, phrase it as a request the creator can accept, adjust or decline, and leave room for their own voice. A learning about what appeared in earlier videos is a reason to ask, not a script.
Check that every product fact the brief repeats from the earlier campaigns is still true. Records describe what the product was then. Version them and re-confirm them using the versioned product facts guide. If the learning came from a specific viewer objection, the objection brief guide shows how to attach proof you own to it.
Finally, write the parked list. Each learning you did not carry gets one line: the sentence, its status, the reason it was left out and what evidence would bring it back. Freeze the sheet with the owner’s name and the date. When the new campaign ends, read the result against the wrong-if line you wrote in advance, then add the new campaign as a third record. The sheet grows into a small ledger of what your own campaigns have and have not shown.
Walk through a fictional intake
Fictional exercise: no real brand, creator, campaign or result was inspected, and no numbers are used. A made-up brand, Brand A, is writing a brief for a third creator campaign. The team has records for Campaign 1 and Campaign 2. For each, they write the goal as first written, the result as observed with the read date and source, and the product version. Campaign 1’s tracking covered the whole window and the team can describe the counting rule, so they grade it sound. In Campaign 2 the link was replaced partway through, so they grade it partial and note which dates are covered.
In the difference list they write down a different creator, a different platform, a different opening, a different destination page and a different product version, including two items that they suspect do not matter. A teammate proposes “videos that show the setup first perform better.” The team reads that in both records, the posts that showed the setup first appeared alongside the higher recorded result. But Campaign 2 is only partial, and the platform differs. They mark it supported with a limit and write that Campaign 2 covers only part of its window.
They write the hypothesis: if the new videos show the setup in the opening, they expect more recorded visits from the tagged link than the brief’s other videos, read on a date written now, and they would call it wrong if the setup-first videos did not differ. They hold the destination page and product version constant and park two other learnings: a claim about posting day, which only one record supports, and a claim about one creator’s audience, which neither record can measure. The exercise predicts nothing about any real creator or brand.
What this page does not decide
This method chooses a hypothesis for an intake. It does not decide whether an earlier campaign worked, whether a creator should return, or what a clear goal should have been. It also does not say why anything happened. The sheet only keeps records, grades and limits apart so the next test starts from a stated question.
It differs from nearby pages in what it produces. The next-test guide starts from one campaign that underdelivered and designs one change to its next run; this page starts from two records of any outcome and selects what enters a brief. The renewal guide decides whether to continue with a particular creator; this page does not look at one creator’s history. The objection brief guide turns a quoted buyer objection into a creator request; this page decides which past result earns a place in the brief at all. If you need a goal for the new campaign, use the measurable objective guide or the client decision guide.
Nothing here supplies a benchmark, a normal rate or a typical result, and we did not look for one. We also did not verify how any particular platform shows data for creator posts, so the Google Analytics and TikTok pages cited above support only the narrow statements attached to them. Questions about contracts, payment or disclosure belong with your agreement and counsel.