How-To Guide
Show missing creator analytics in a client report without turning them into zeros
Mark each missing creator metric with a reason, never a zero. Keep unknown, withheld and delayed cells visible and totals honest in a client report.
By the Superdirector editorial team. Instagram, YouTube and Google Analytics help pages reviewed October 30, 2026.
At a glance
How should a client report show missing creator analytics?
Show a missing creator metric as a missing cell with a stated reason, and keep 0 only for a count the source measured as zero. List every cell the report promises, give each one a state (measured, measured zero, not yet available, withheld by the platform, not offered for this item, or not captured), check the platform’s own page for the gap, and sum only measured cells with a coverage count such as n of m posts. Write the state beside the value in the same table and end each gap with an owner and a date. Instagram’s API reference, for example, returns an empty data set instead of 0 for unavailable data.
- Unknown is a state with a reason, never a zero.
- Totals carry coverage: n of m posts measured.
- Keep estimates out of measured totals.
Direct answer
Short answer: a client report should show a missing creator metric as a missing cell with a stated reason, and keep the number 0 for a count the source actually measured as zero. Before the report goes out, list every cell it promises, give each one a state (measured, measured zero, not yet available, withheld by the platform, not offered for this item, or not captured), and write the reason beside it. Then add up only what was measured and say how many posts that covers. A client who reads “0 saves” will act as if nobody saved the post. A client who reads “not captured, creator has not sent the screen” will ask for it.
This is for an agency or brand marketer who is assembling a report from creator-supplied screens, exports and platform dashboards, and who has found gaps. The decision is narrow: how to present each gap so that it cannot be mistaken for a result. It does not tell you why a creator’s numbers are low, whether a campaign worked, or what to pay. A general structure for the whole report, with its summary, KPIs and recommendations, is in the social media report guide; this page covers only the cells that report cannot fill.
The blank tools are the unknown-versus-zero map, the report card and the CSV register. They are teaching aids with no real creator, post or figure in them.
List every cell the report promises
Start from the report you intend to send, not from the data you happen to have. Write one line for every cell the report will show or imply: each creator or post, each metric, the window, and the platform surface the number would come from. If the report has five posts and four metrics, that is twenty lines before a single value is entered. Gaps are invisible when you only list what arrived, and the missing ones are exactly the cells a client will later ask about.
For each line, write down the metric as defined by the source (for example, a view as the platform counts it), the date range with its time zone, and who would supply it: the platform’s own dashboard through your access, an export a creator sends, a screenshot, or an analytics property you control. Keep the platform-supplied and creator-supplied numbers on separate lines even when they carry the same label, because they may use different windows or scopes. The Instagram Collab metrics guide shows that matching in detail for one case.
Mark which cells the client was promised. If the agreement or kickoff note named “views, saves and shares for every post,” a gap in saves is a delivery question, not just a data question. If a metric was never promised, it can still appear, but its absence is not a shortfall. This one distinction decides later whether you write “not yet supplied” or “not part of this report.” Record the promise in the register’s notes column, with the document and date, so that the wording in the report points to a real commitment instead of a recollection.
Give each missing cell a reason, not a zero
When a value is not in hand, choose one of six states and write what you saw. Test them in this order and stop at the first that fits, as the map shows.
| State | What it means | Evidence to record | What the report cell says |
|---|---|---|---|
| Measured value | The source shows a number for this item and window | Source, window, time you read it | The number |
| Measured zero | The source shows 0 for this item and window | The screen or export row that reads 0, with its window | 0, and nothing else |
| Not yet available | The source says the data is delayed or still processing | The delay statement you read and the date it was posted | Pending, with the date to recheck |
| Withheld by the platform | A threshold or privacy rule hides the value | The notice or rule you read, if one is shown | Withheld by the platform, not zero |
| Not offered for this item | The metric does not exist for this format, account type or surface | The source line that excludes it | Not available for this format |
| Not captured | Nobody has read it: not sent, not asked, or the capture failed | Who was asked, when, and what came back | Not captured, with the next step |
The reason matters more than the label. Two cells that both look empty can need opposite actions: a withheld value will not appear however often you ask, while a not captured value is simply a request you have not yet made. A not yet available value will usually resolve on its own. Reporting all three as “N/A” hides which of them is waiting on you.
Also watch the opposite error, a zero that is not a count of nothing. A creator’s screen may show 0 because the creator never opened the right tab, because the metric is one the platform shows as zero for a whole region, or because the post is too new. Treat a zero as measured only when you can name the surface and the window it came from. If you cannot, the honest state is not captured, and the cell stays unknown until someone reads the source again.
When enlarged, scroll horizontally to read the diagram.
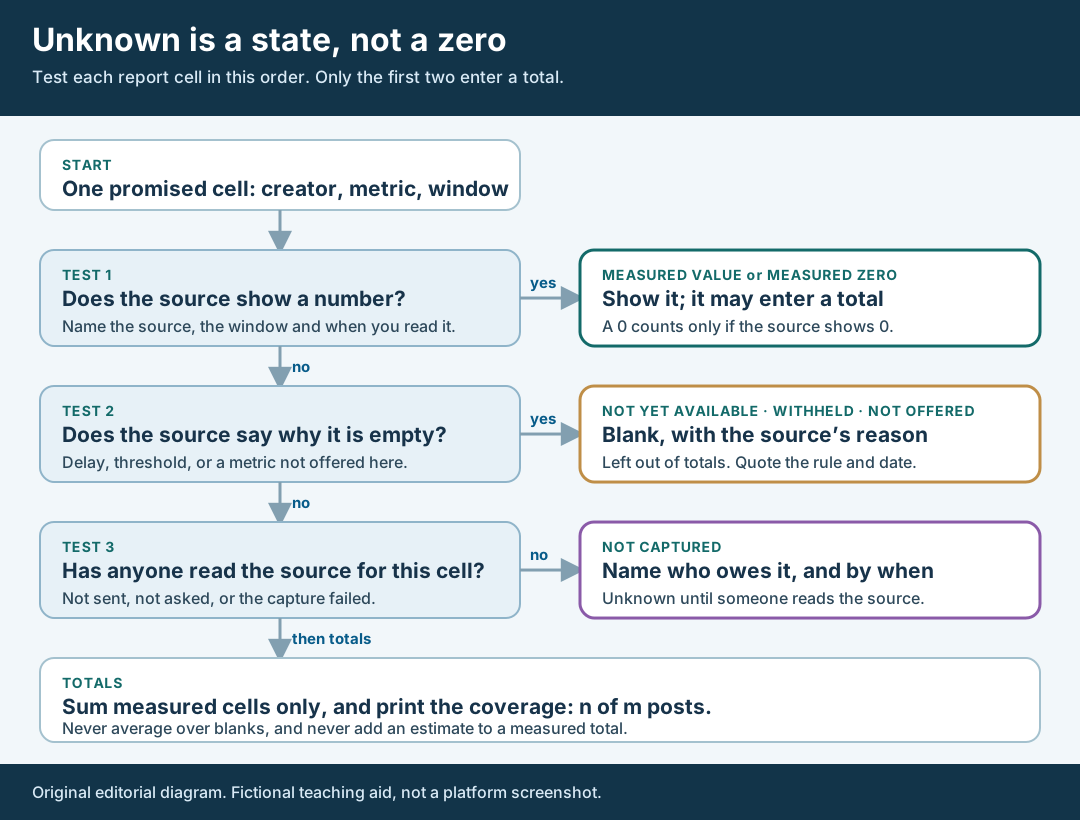
An original editorial map. Only a number the source shows enters a total; every other state stays visible with its reason.
Original visual by Superdirector editorial team. Creation date not recorded.
Check the platform’s own rule for the gap
Before you tell a client that a number is unavailable, read what the source itself says about it. The official pages below were read on October 30, 2026. They support the specific statements made here and nothing wider; thresholds and metric lists change, so recheck the page on the day you write the report.
Instagram. Meta’s Instagram Platform reference for media insights says that when requested data “does not exist or is currently unavailable” the API returns an empty data set instead of 0. That is the plainest official support for this whole method: an empty response is not a zero count. The same page says metric calculations can lag by up to 48 hours, that insights are unavailable for media inside an album, that story metrics are only available for 24 hours, and that a story metric with a value below five returns an error saying there are not enough viewers. It also says story replies returns 0 for stories created by users in Europe and Japan, which is a returned zero that a client should not read as “nobody replied.” (Instagram media insights reference)
At account level, Meta’s user insights reference says follower_count and online_followers are not available for business or creator accounts with fewer than 100 followers, that follower_demographics is not returned under 100 followers, and that engaged_audience_demographics is not returned with fewer than 100 engagements in the timeframe. So a small creator’s missing audience breakdown can be a platform rule, not a creator’s omission. (Instagram user insights reference)
YouTube. YouTube’s help page on limited data says reports can be incomplete when a video or channel has little traffic in the period, and that analytics may show a message such as “Not enough demographic data.” It says values can be hidden when they fall below a threshold, that the exact thresholds are not published, and that totals can differ from the sum of visible rows because hidden rows may still count in the total. Its own example is a video with 1,000 views whose country list omits a small country while the total still reads 1,000. It also says demographics and geography do not appear for private or unlisted videos. (Understand limited data in YouTube Analytics). The partial audience geography guide uses these ideas for country tables; here they are applied to the report cell itself.
Google Analytics 4. If part of your report comes from a property you control, the label (not set) is a placeholder name that Analytics uses when it has not received any information for a dimension, according to Google’s help page, which lists causes such as an unlinked Google Ads account or a missing session_start event. It also says a custom parameter can show (not set) during the first 24 hours after it is registered. So (not set) is a missing value to explain, not a channel of its own. (GA4: what the value (not set) means). Separately, Google says data thresholds can hide data in reports that include demographic data so users cannot be identified, and that the report’s data-quality indicator shows when thresholding was applied. Widening a narrow date range may bring in enough users to show it. (GA4 data thresholds)
Do the arithmetic only on what was measured
A missing cell becomes dangerous at the moment you add, average or compare. A spreadsheet that treats a blank as zero will quietly lower a total and drag an average down, and it will not tell you it did so. Decide the rules before you build the report, and write them where the client can read them.
Use these four. First, a total is a sum of measured cells and carries its coverage: “views across the posts we could read, n of m posts,” never a bare total. Second, an average divides by the cells that had a value, and the report says how many that is. Third, a comparison between two creators or two periods needs both cells measured for the same metric and window; otherwise the comparison row reads “cannot compare” with the reason. Fourth, a ratio such as a rate needs both the top and the bottom number in hand; if either is missing the rate is missing, not zero.
Do not fill a gap with an estimate from neighbouring posts and place it in the total. A projection can be a useful internal note, but it is an assumption, and mixing it into measured figures makes the whole row look observed. If a client asks for one, show it in its own labelled line, outside the total, with the assumption written next to it. The organic and paid results guide makes the same separation for a different pair of numbers.
Walk through a fictional report
Fictional exercise: no real brand, creator, post or result was inspected, and the numbers are invented to show the arithmetic. A made-up agency prepares a one-page report for Brand B on four posts by four fictional creators. It promised views and saves for each post. Creator 1’s screen shows 1,200 views and 40 saves. Creator 2’s shows 800 views and 0 saves. Creator 3 sent views, 950, but no saves screen. Creator 4 has not sent anything yet.
Sorting each cell: Creator 1’s two cells are measured values. Creator 2’s views are measured, and the 0 saves is read from a screen that names its window, so it is a measured zero. Creator 3’s saves are not captured, because the agency has not asked for that screen yet. Creator 4’s cells are also not captured, with a request date. Nothing was found that points to a platform threshold, so no cell is marked withheld.
The arithmetic follows the rules. Views total 2,950 across 3 of 4 posts, not “2,950 views” and not an average of 737 over four posts. Saves total 40 across 2 of 4 posts, and the report does not add Creator 2’s zero to a guess for Creators 3 and 4. A line in the report reads, “Saves: 2 of 4 posts measured; one measured zero; two not captured, requested October 30.” If a recheck later shows Creator 4 posted a story rather than a feed post, one cell would move to not offered for this item and the note would say why.
Write the unknown into the client report
Place the gaps in the same table as the numbers, not in a footnote at the end. Use the same column for value and state, so the eye reads “1,200” and “Not captured” in the same row of cells. Keep a short key under the table that explains the six states in plain words. Do not use colour as the only signal: write the state in text, so a printed or screen-read copy says the same thing.
Then write one coverage sentence for each metric in the summary: how many cells were measured, how many were zero, and how many are pending, withheld, not offered or not captured. Avoid headline words such as “strong” or “weak” for a metric whose coverage is partial.
Finish each gap with an action line: who will supply it, by when, or why no one can. A withheld value has no action beyond “recheck over a longer window,” which is the advice both YouTube’s and Google’s pages give for thresholds. A not-captured value names the creator and the date of the request. A not-offered value says what the client may use instead, such as the post’s own public figures, labelled as such.
Before sending, reread the table once as the client would. Can you find a zero that is not a measured zero? Can you find a total with no coverage? If yes, fix it first. Then save the report card and the register with the report, so the next period starts from the same cell list. If the work is wider than missing cells, the measurable objective guide covers what a campaign should have agreed to measure in the first place.
What this page does not decide
This method decides how to display and add up cells you do not have. It does not tell you why a number is missing beyond what a source says, and it does not tell you whether a creator is hiding something. A gap that follows a platform rule is not the creator’s fault, and a gap that follows an unanswered request is a follow-up, not an accusation.
It also does not choose which metrics a campaign should be judged on, convert one platform’s counts into another’s, or settle fees when a promised report is incomplete. Those belong in the agreement and with the deal owner. Nothing here measures how often creators omit analytics, how many cells a typical report lacks, or whether showing gaps changes a client’s decision. Those numbers are not available to us and are not claimed. The page is an editorial method for keeping unknown and zero apart.
Sources and scope note
Sources read on October 30, 2026: Instagram media insights reference for the empty-data-set-instead-of-zero statement, the 48-hour lag, album, story and story-replies limits; Instagram user insights reference for the 100-follower and 100-engagement conditions; Understand limited data in YouTube Analytics for low-traffic limits, unpublished thresholds and total-versus-visible-row differences; GA4: what the value (not set) means for the placeholder definition and the 24-hour note; and GA4 data thresholds for thresholding and the data-quality indicator. Each page can change. They describe platform behaviour, not any creator’s account, and the examples on this page are fictional.