How-To Guide
How to decide what a small creator test can teach when it is too small to compare rates
Write the questions, count units and events, show the range, then sort each finding into learn, estimate or cannot say before you act on a small creator test.
By the Superdirector editorial team. Statistical and NIST pages reviewed October 30, 2026.
At a glance
What can a small creator test teach you when it is too small to compare rates?
Sort every finding into one of three bins. Learn: a dated observation that something happened or broke, which can show a failure is possible but never how often. Estimate: a rate you may act on only if the whole range, worked out from the counts, points to the same action. Cannot say: a rate whose range spans your decision, so you keep the counts, drop the ranking and name the extra evidence that would settle it. Always show counts and range beside any percentage.
- Write the questions and the decisions they feed before you read any result.
- Show the range from the counts beside every percentage; a wide range is the honest answer.
- Turn a cannot say into a next test, and fix whatever the test showed was broken.
Direct answer
Short answer: do not rank a small creator test by its percentages. Instead, put every finding in one of three bins. Learn is a dated observation that something happened or broke. Estimate is a rate you may act on, but only when the whole range worked out from your counts points to the same action. Cannot say is a rate whose range spans the decision you were trying to make. Show the counts and the range beside any percentage, every time, and write down what extra evidence would move a “cannot say” into a firm answer.
This is for a small brand or the agency serving one, after a test with a handful of creators or posts, where someone has already asked “which creator did best?” or “which format won?”. The decision is narrow: what to treat as learning, what to treat as an estimate, and what to leave unanswered. It does not tell you how many creators to buy, whether a creator should be renewed, or what caused an outcome. Those have their own pages, listed in the boundary section below.
The reason to sort is that small counts feel like data and behave like anecdotes. Two of four creators producing a qualified signup reads as “50%”, yet the range consistent with those counts is enormous. Use the blank learning card, the CSV register and the learning versus estimation map to keep the sorting in one place.
List the questions the test was meant to answer
Start with the questions, and write them before you open a report. A small test usually carries several questions at once: did the tracked link work for a phone visitor, did creators post inside the window, did any visitor reach the signup, did one opening line seem to draw more replies than another. Each is a different question with a different kind of answer, and treating them as one “performance” question is how a single number ends up carrying five meanings.
For each question, write one line stating the decision it feeds. “Should we re-contact the two creators whose posts drew signups?” is a decision. “See how it went” is not. If you cannot name a decision, the question is curiosity, and you can still record it, but it should not set the budget. The same discipline is behind choosing a measurable creator campaign objective, and a test that never wrote its event down cannot be sorted afterwards, so settle the conversion event before the first post.
Count the units and the events for each question
For each question, write two plain counts. The units are the things you counted: creators, posts or visits. The events are how many of those units had the thing you asked about. “Qualified signup” is an event. “Link errored on a phone” is an event. Add the definition of the event in words and the place the count came from, such as a named report or a dated capture, so someone else could recount it.
Choose the unit that matches the question. If you ask whether creators tend to produce a signup, the unit is the creator, and four creators is a sample of four, even if their posts drew thousands of views. Views are not extra creators. Counting every visit as a unit makes the sample look large while all the visits come from the same four decisions about what to post. When one creator posted twice, decide in advance whether the unit is the creator or the post, and write the choice on the card.
Keep zero as a real answer. “0 of 8” says something, and it should not be swapped for a blank or a dash. If a report simply does not show the event, mark it not measured instead of zero, as in showing missing creator analytics without zeros. Set the counting dates too, since an event that has not had time to occur is not a failure to occur; the observation window guide covers fixing those dates.
Show the range before you show the rate
A rate such as “50%” is one point drawn from a small count. A range shows how much the same counts would allow. The NIST/SEMATECH e-Handbook of Statistical Methods describes two ways to build a range around an observed proportion. One, the Wilson method, uses a closed-form formula; NIST notes its lower limit cannot be negative. The other uses exact binomial equations, which NIST presents for cases where the number of failures or the sample size is very small, and which give an interval that is not symmetric around the observed proportion. NIST handbook: confidence intervals for proportions. NIST’s own worked example has 20 units with 4 failures, and the 90% exact interval runs from about 0.07 to 0.40. That is a wide band from a sample of 20, and a creator test is usually smaller.
You do not need to compute these by hand. Any statistics package or a statistician can produce an exact binomial interval from two numbers, the units and the events. What matters here is the habit: write the low and high limit beside every rate, name the method on the card, and keep the counts next to it. State the confidence level you used, such as 95%, because a different level gives a different range. A range is a statement about the method applied to your counts, and it does not say the true rate is probably inside it for any one creator.
When no unit had the event, a quick check exists. The rule of three says that if an event does not occur in n units, the interval from 0 to 3/n is a 95% confidence interval for its rate. That page, a secondary source, says that when n is greater than 30 this is a good approximation of results from more sensitive tests, and its derivation assumes the rate is close to zero, so for the tiny samples in a creator test treat 3/n as a rough guide and use an exact interval when the number matters. The plain-language meaning is the same either way: no events in a small sample still leaves a lot of room for a high rate, and “zero so far” is not “never”.
Low counts raise a second problem, which is that the ones that look significant are less trustworthy than they appear. Button and colleagues, writing about neuroscience studies, state that low statistical power reduces the chance of detecting a true effect and also reduces the likelihood that a statistically significant result reflects a true effect, with overestimates of effect size among the consequences. Button et al., abstract. That paper is about a different field, and we draw only its general statistical point: the standout creator in a tiny test is exactly the result most likely to look better than it is. We make no claim from it about creator campaigns themselves.
When enlarged, scroll horizontally to read the diagram.
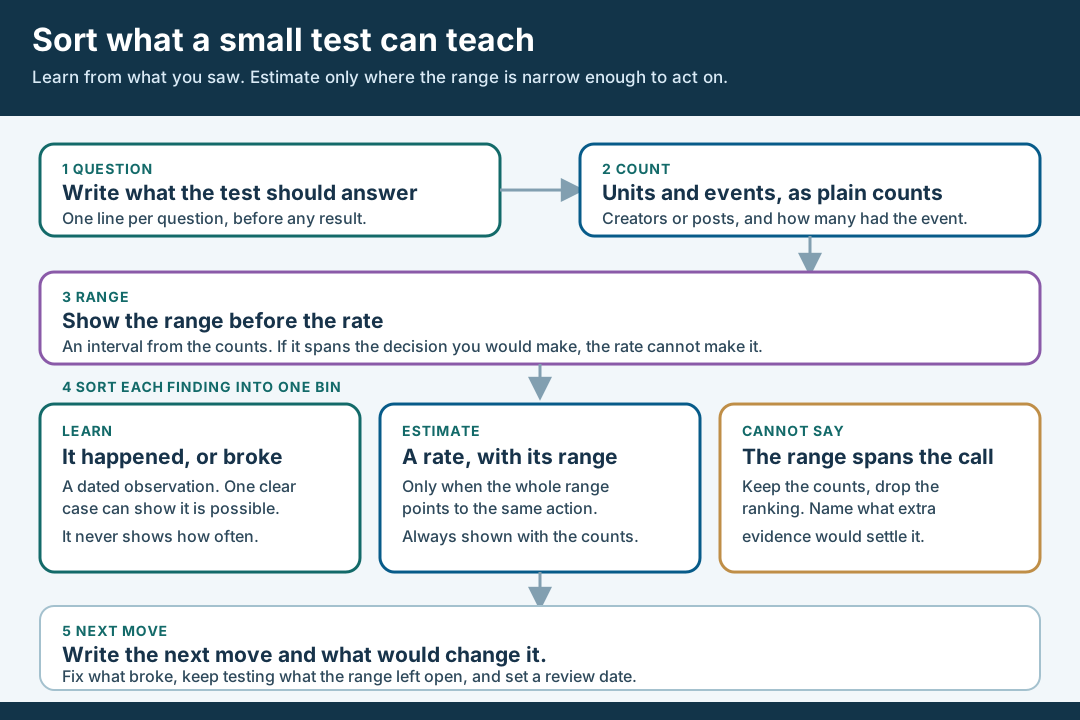
An original editorial map. A rate is only an estimate when its whole range points to one action.
Original visual by Superdirector editorial team. Creation date not recorded.
Sort each finding into learn, estimate or cannot say
Now sort each question’s result into exactly one bin. The test for the bins is short. Learn: is this a dated, sourced observation about what happened, that stays true whatever the counts are? Estimate: does the whole range, not just the point, lead to the same action? Cannot say: does the range include values that would make you choose differently? If so, the rate cannot make this decision, however tidy the percentage looks.
| Bin | What counts as evidence | What you may say | What you may not say |
|---|---|---|---|
| Learn | A dated, sourced observation: a link that failed on a named phone, a comment that asked a question you had not planned for, a post that missed the window | “This happened on this date, here is the capture”; “this can fail”; “this needs a fix” | How often it happens, or that it happened to every creator |
| Estimate | A rate whose whole range points to one action, shown with its counts and method | “About this share, between these limits, on these counts” | A ranking that ignores the limits, or a rate quoted without its counts |
| Cannot say | A rate whose range spans the decision | “We do not have enough evidence either way; we need X” | “It does not work”, “it works”, or “creator A beat creator B” |
Most of what a small test yields falls in the first and third bins, and that is fine. Learning is where a small test is strongest, because one clear case can show a failure is possible: a bad destination, a confusing instruction, an unexpected objection. It cannot show how common it is. Estimates are rare in a small test, and when one appears it is likely to be for a very lopsided result, such as 0 of 30. Cannot say is the honest label for most head-to-head questions, and it is more useful than it sounds, because it names what the next test must supply.
The American Statistical Association’s 2016 statement on p-values, as summarized in this account of its six principles, says scientific conclusions and business or policy decisions should not be based only on whether a p-value passes a specific threshold, and that a p-value or statistical significance does not measure the size of an effect or the importance of a result. For a small brand the practical reading is simple: crossing a line does not turn a “cannot say” into an “estimate”, and missing it does not turn it into “no effect”.
Two cases need extra care. A single viral post is one observation, not a rate for the creator, and the viral post fit guide covers whether it belongs in the evidence at all. And a creator’s repeated format is a different question from a single hit, which the format repeatability check approaches by sampling dated uploads, not by reading one campaign’s rate.
Walk through a fictional test
Fictional exercise: no real brand, creator, campaign or result was inspected. A made-up brand, Brand A, ran a test with four creators who posted two videos each, eight posts in all. Before launch it wrote three questions on the card. Q1: did each creator produce at least one qualified signup, feeding the decision whether to keep sourcing creators of this type? Q2: did the tracked link work for a phone visitor, feeding whether to fix the destination before any more posts? Q3: did one of two opening lines draw more signups, feeding which line to brief next?
The counts were these. Q1: 2 of 4 creators had a signup. Q2: on 1 of 8 posts, the dated phone check showed an error page. Q3: the first opening line was on posts with 3 signups in total, the second on posts with 1. For Q1 the reviewer computed an exact 95% interval and wrote it beside the rate: about 0.07 to 0.93. Those limits were computed by us from the fictional counts to show the habit, and they are not a benchmark for anything. The range runs from almost never to almost always, so it spans the decision. Bin: cannot say. The next move names what is missing: more creators of this type, with the same written event.
For Q2, the reviewer does not need a rate at all. The phone check on that post is a dated capture, and one clear failure shows the destination can break. Bin: learn. The range for 1 of 8, about 0.003 to 0.53 by the same exact method, is wide, which is why the card says only that it can fail and not how often. The move is to fix the cause and retest the other seven posts’ links.
For Q3, 3 signups against 1 is a count of four events in total, and the reviewer cannot treat it as a winner. Bin: cannot say. The card records what would settle it: the same creators or comparable ones, one change between the two lines, and a set review date.
Write the next move and what would change it
Close each question with one next move, one owner and one date. For a learn finding the move is a fix or a check: repair the destination, add the question a commenter raised to the brief, move the posting window. For an estimate, the move is the action the whole range supports, taken with the counts attached. For a cannot say, the move is the smallest piece of extra evidence that would settle it, stated as a plain requirement such as “six more creators of this type, same event, same counting window”, or “one change between the two opening lines, nothing else”.
Then write the change condition: what result would make you decide differently. “If the next eight creators produce signups on fewer than a stated share, we stop sourcing this type” is a rule you fix before the evidence arrives, so the evidence cannot move the line. This page does not choose that share for you, and we did not find a benchmark that would fit your product and price. It comes from your own costs and your own tolerance for a wrong call. Where a past campaign supplies a hypothesis, the carry-one-learning guide shows how to bring it forward as a hypothesis with limits.
Report the sorted card to whoever owns the decision, not the unsorted percentages. A client who sees “50% of creators converted” will remember 50%. A client who sees “2 of 4; range about 0.07 to 0.93; cannot say; here is what we will do next” knows how much weight it will bear. When the next test finishes, add its counts to the same card and recompute, since combining evidence is how a small brand builds the sample it started without.
What this page does not decide
This method sorts what a small test can and cannot support. It is not a statistical consultation, and it does not replace one when a decision is costly. It does not tell you how many creators to sign, whether an outcome was caused by a creator or something else, or whether to keep a creator. Those sit on neighbouring pages.
The closest existing pages answer different questions. The weak campaign next test guide starts after a campaign underdelivers and designs one changed variable; here the test may have gone well or badly, and the problem is how much its numbers can say. The past campaign learning guide carries one lesson into a new brief; this page decides which findings qualify as lessons in the first place. The renewal decision guide separates reach from outcomes for a creator you already work with and picks renew, change, test, pause or end; this page applies across creators and never renews or ends anyone. The artifact here, a learn, estimate or cannot say sort backed by counts and ranges, is not in those pages.
We did not measure how often small creator tests mislead, how many creators a typical test needs, or what range is acceptable, and we make no claim about them. We did not review any real brand’s test, and all examples are fictional. The statistical points come from the NIST handbook page, the rule of three page, the abstract of one paper from a different field and a summary of the ASA statement, each linked above. We did not read the full text of the ASA statement or of the Button paper, so we quote nothing from them beyond what those pages state. Ranges quoted in the example were computed by us from the fictional counts using the exact binomial method that NIST describes.