How-To Guide
Compare GA4 session source with a creator’s click report, one scope at a time
Match the unit, scope, window and route of a GA4 session-source row to a creator-supplied click count, then record the gap class without a loss rate.
By the Superdirector editorial team. Google Analytics help pages reviewed October 30, 2026.
At a glance
How should a team compare GA4 session source with a creator’s click report?
Treat the two numbers as different measurements before comparing them. Record what the creator’s tool counts as a click, its filters, window and time zone. Then read GA4 at session scope, using a Session source, medium or campaign dimension with sessions, filtered on the exact values you deployed in the link, for the same dated window. Place both counts side by side, name the best-supported reason class for any difference (unit, scope, window, route, collection or unknown), and report the gap with its open questions rather than as a loss rate.
- Pin each report’s unit, filters, window and time zone first.
- Read GA4 with a session-scoped source dimension and sessions.
- Classify the gap; never convert it into a loss rate.
Direct answer
Short answer: a creator’s click report and a GA4 session-source row are two separate measurements, so compare them only after you have written down what each one counts. The creator’s tool records whatever it calls a click, under its own filters, window and time zone. GA4 records sessions that your tag collected, and labels each with a source that belongs to that session. Pin both definitions, confirm they describe the same published link and the same dated window, read GA4 with a session-scoped source dimension, then place the counts side by side and name the best-supported reason for the difference.
This is for an agency or brand marketer who was sent a click number by a creator, found a different session number in GA4, and has to say something to a client. The decision is narrow: what the two numbers can and cannot be said to show together. It does not decide whether the creator drove sales, whether either number is wrong, or what a fair rate is. The page gives you a method for stating the gap honestly.
Use the blank comparison card, the CSV register and the scope map. All three are blank or fictional teaching aids. None represents a real campaign, creator or result.
Pin what each report counts
Start with the creator’s side, because it is the one you did not build. Ask for the report itself, not a typed total, and record four things in the tool’s own words: the name of the tool that produced it, the unit it counts (every tap, unique taps, visits, or something else), any filters it states, such as bot removal or deduplication, and the window and time zone it covers. If the report states none of these, write “not stated.” An unstated definition is an open question, not a default.
Then record the GA4 side with the same discipline: the property, the web stream, the report you used, the dimension, the metric name, the date range and the property’s time zone. Google describes a session as a period during which a user interacts with your website or app, and says GA4 records a session_start event when one begins. Google’s session definition also says a session ends after 30 minutes of inactivity unless the timeout is changed. So one visitor can produce several sessions, and a tap that never loads your page produces none.
Write the two units next to each other. A line such as “creator tool: [its unit]; GA4: sessions that began with a tagged source” already shows most readers why the numbers need not match. Do this before looking at the totals, because once two numbers are in front of you it is tempting to explain whichever one looks odd.
One more note belongs here. GA4 excludes known bot and spider traffic automatically. The bot-exclusion help page says this exclusion cannot be disabled and that Analytics does not show how much traffic was removed. A creator’s tool may or may not filter the same way, and its documentation is the only place to learn that. If the creator’s report does not say, record bot handling as unknown on both sides rather than guessing which side is cleaner.
Match the link, window and time basis
A click report is only comparable to a GA4 row if both describe the same link. Record the URL exactly as the creator published it, including any shortener or link-in-bio page between the post and your site. Then record the destination URL as you deployed it, with its UTM values. If the creator’s report is for a short link and your tags live on the destination, the two reports cover different hops of one route. That is fine, as long as you say so.
Next, fix one window and write it in both reports’ terms. Take the start and end that you chose, and note the time zone each report uses. If the creator’s tool reports in one zone and your GA4 property in another, a day boundary can move traffic from one date to another, and a short window makes that visible. Aligning post time across zones is its own task, so keep this step to recording each zone and choosing a window long enough that a day edge cannot change the story. Where you cannot get the creator’s time zone, mark it unknown.
Finally, check that the tagged URL arrives intact. Google’s custom campaign URL page says to always use utm_source, utm_medium and utm_campaign when you add parameters, that values are case sensitive so Meta and meta become separate rows, and that missing parameters produce “(not set)” values. The way to confirm the parameters survive a real route is in the redirect trace guide and the mobile link test. Run one of them before blaming a gap on anyone.
Read GA4 at session scope
GA4 reports traffic source at three different scopes, and the choice changes the answer. Google’s traffic-source dimensions page describes them this way: user-scoped dimensions, labelled “First user,” show where new users come from; session-scoped dimensions such as Session source / medium are assigned at the session level, with new values assigned each time users return; and event-scoped dimensions, with no prefix, attribute credit for a key event, and show “(not set)” for non-key events.
| Scope | Dimension example | What it can answer | Why it may not match a click report |
|---|---|---|---|
| Session | Session source / medium, Session campaign | Which tagged source a session began under | Counts sessions, not taps; needs the tag to collect |
| First user | First user source / medium | Where a new user was first acquired | A returning visitor keeps the first value on later visits |
| Event | Source / medium (no prefix) | Which source gets credit for a key event | Credit for an event, not a count of arrivals |
For a click-report comparison, the closest analogue to a click that reached your page is a session that began under your tagged source. In the Traffic acquisition report, Google says each cross-channel traffic-source dimension that includes the word “Session” describes a user’s most recent session, and the Traffic acquisition page lists Session source / medium and Session campaign among the available dimensions. Read the metric called Sessions, filter on the exact source, medium and campaign values you deployed, and copy those values with their case.
Two cautions follow. First, a filter on a spelling you did not deploy returns a row that looks smaller than it is, so compare the report’s listed values to your URL character by character. Second, do not switch to a first-user or event-scoped dimension because its number is closer to the creator’s. That swaps the question. If you need the other scope for a different reason, run it as a separate, labelled row. The Spark Ad guide and the TikTok purchase gap guide treat paid-platform counts; this page is for a creator-supplied report of an organic or link-in-bio route.
Line up the counts and classify the gap
Now put the two counts side by side, each with its unit, window and date read. The scope map shows the same order as a picture. Then assign the difference to the best-supported class, with the evidence for it and the evidence against it. You may use more than one class, but you must show your reason for each one.
| Gap class | What it means | Evidence you need | What you may say |
|---|---|---|---|
| Unit | The creator’s tool counts something other than a session | The tool’s own definition of a click | “These are different units,” with both definitions |
| Scope | The GA4 row used a different source scope or filter | Dimension scope and the exact filter values | “GA4 was read at session scope with these values” |
| Window or time basis | Dates or time zones differ between reports | Both windows and zones, in writing | “The windows are not aligned to the minute” |
| Route or tagging | Parameters were lost, mistyped or altered on the way | A dated test of the live link and landing page | “A test showed [what you saw]” |
| Collection | The page loaded but the tag did not record the session | Tag and consent checks in your own property | “Collection was not verified for this window” |
| Unknown | No evidence separates the candidates | A note of what is missing and who can supply it | “The reason is unresolved,” with an owner |
The point of the table is the last column. You may claim a class only if the evidence column is filled. If a candidate reason has no evidence, it stays a hypothesis in the open-questions box. This also protects the creator: a gap is not an accusation, and a class such as “unit” explains many differences without anyone doing anything wrong.
Avoid the shortcut of dividing one count by the other. The result looks like a rate, but it mixes two units, two sets of filters and two collection paths, and it hides which of those moved. Counting sessions is also not counting people, so the ratio is not a share of visitors either. Write the two counts and the class instead.
When enlarged, scroll horizontally to read the diagram.
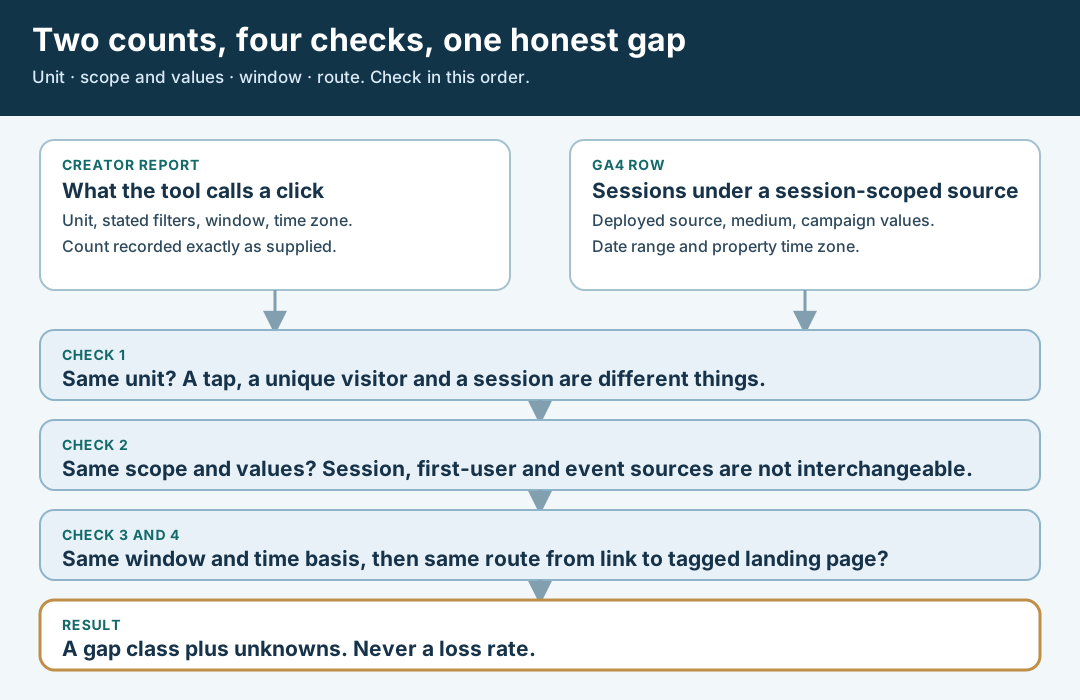
An original editorial scope map. The result is a gap class and its open questions, not a rate.
Original visual by Superdirector editorial team. Creation date not recorded.
Walk through a fictional comparison
Fictional exercise: no real brand, creator, campaign or number was inspected. Brand B asked Creator R to put one link in a video description. Creator R later sends a screenshot from a link tool and a line saying the link was “clicked” a number of times. Brand B’s analyst records the number as supplied, writes the tool name, and finds that the tool’s page names its unit but says nothing about bot handling or time zone. Those two fields stay “not stated.”
On the GA4 side, the analyst opens Traffic acquisition for the web stream, selects the same dated window, and filters Session source / medium on the exact values in the tagged URL. The row shows a different count of sessions. The analyst notices that the deployed utm_source was written with a capital letter and that the filter used lowercase. After correcting the filter to match the deployed value, the row is re-read and the new count is recorded with the time it was read.
The two counts still differ. The analyst checks the live link on a phone and sees the parameters survive the redirect, so route or tagging has a dated test against it. The creator’s unit is a tap on a short link, which is a different unit from a GA4 session, so unit has a documented reason. Bot handling and time zone on the creator side are unknown, so they go in the open questions. The report says: two different units, one reading corrected for a spelling error, a route test that passed, and two creator-side definitions still unresolved. It does not say traffic was lost, because nothing supports that claim. The scenario predicts nothing about a real creator, and it carries no performance figure.
Report the comparison with its limits
Write the report in the same order as the card. First the anchors: the link as published, the destination as deployed, the window and both time zones. Then the two counts with their definitions: “the creator’s tool reported [count] of [its unit]; GA4 property [name] reported [count] sessions under [dimension and values], read on [date and time zone].” Then the gap class with its evidence, and a short list of what remains unknown. Each unknown gets an owner and a date for the next check.
Keep the language plain for a client. A sentence that holds up reads: “These two numbers measure different things and were recorded under different rules. We cannot say how many people the link reached from either one.” That sentence is accurate even if the later checks do not change the picture. It also keeps the report from implying that GA4 is the authority and the creator’s tool is the error, which nothing in these sources supports.
If the gap matters to a decision, move to evidence that sits closer to the business. The coupon-code reconciliation guide joins visits to owned orders, and the views-without-visits diagnostic starts from views that produced no qualified arrival. Neither number on this page is a result; each is an input to a later question.
Ask the creator, ahead of the next campaign, for the same few fields every time: the tool’s name, its unit, its stated filters, its window and its time zone. That small request turns the next comparison from a negotiation into a lookup, and it costs the creator very little.
What this page does not decide
This method compares two traffic counts. It does not decide whether a creator should be paid, renewed or dropped; the renewal decision guide handles that with a wider evidence set. It does not choose a conversion event or observation window, which is covered by the window decision guide. It also does not replace a pre-launch check of the destination, covered by the destination test guide.
Nothing here measures how often creator click reports and GA4 sessions differ, how large the difference usually is, or which tools are more accurate. Those numbers are not available to us and are not claimed. The Google pages cited above support the narrow definitions quoted from them: what a session is, how session, user and event scopes differ, how UTM values are handled, and that known bots are excluded and cannot be switched off. Other behavior, including how any third-party link tool counts a click, belongs to that tool’s own documentation.
The page is an editorial method for keeping units, scopes, windows and routes apart so a gap can be stated without blame or guesswork. Its only requirement is that each claim about a difference shows the evidence behind it.