How-To Guide
How should a brand calculate influencer conversion rates?
Compare influencer conversion rates using views, sessions, orders and users. Includes a fictional cohort and a worksheet for choosing a defensible rate.
By Bell Chen, founder of Superdirector — how the analysis works.
At a glance
How should a brand calculate influencer conversion rates?
Calculate the rate that answers the actual question: views to visits, visits to orders, or views to orders. Name each source’s unit, cohort and time window first. Orders per session, sessions with a purchase and purchasing users are different numerators. Separate view-based count yields from the unverified percentage of exposed people who converted.
- A play, click, session, event, order and person are different counters.
- A purchasing session is counted once even when it contains multiple orders.
- Without an exposed-person join, a view-based yield is not a viewer-conversion probability.
Choose the question before choosing a denominator
“The creator converted at 3%” is incomplete. It might mean three orders per 100 site sessions, three purchasing people per 100 visitors, or three actions per 100 reported views. Those are different measurements. This page helps a brand choose what it can actually report after receiving the source records; it does not pick tracking software or promise a good industry rate.
| Question | Possible count relationship | What must be established |
|---|---|---|
| Views→visits | Eligible visits divided by the stated view or viewer units | Same placement/period and explicit units. Sessions per play is a count yield; a viewer-to-visitor probability additionally needs a linked, compatible person cohort. |
| Visits→orders | Orders per session, sessions with a purchase, or purchasing users per eligible user | Choose one numerator and denominator. Orders, converting sessions and people are not interchangeable. |
| Views→orders | Associated orders per reported play, or purchasers per eligible viewer | A count yield is different from the percentage of exposed people who bought. Without an exposure join, that person-conversion rate stays unknown. |
A view counter may count repeated plays; a reach field may name accounts or another unique unit. Preserve the actual native definition, post identity, capture date and paid/organic scope. Do not silently swap views for unique viewers. For a real route problem, use the views-without-qualified-visits diagnostic; it checks the path rather than inventing an audience loss rate.
A descriptive yield can be useful if its question and compatible scope are explicit, such as reported campaign sessions per 100 reported plays in the same period. It is not a nested people funnel. If the reports describe different links, mixed periods or unrelated campaigns, omit even that yield and request the missing scope. Do not subtract views, clicks and sessions to estimate people lost.
Separate events, sessions and people
Google defines a session as a period of website/app interaction; a user can have several sessions. Session identifiers and user identifiers have different jobs. Google recommends combining the user and session identifiers when distinguishing sessions outside Analytics, and explains that reported session totals use estimation. A raw event export, a native report and a manually joined cohort need not produce identical counters.
In the Traffic acquisition documentation, Event count counts event triggers, while Session key event rate uses sessions in which a key event happened divided by total sessions. A session with two purchases still enters a sessions-with-purchase numerator once. Also check which key event the report means: an any-key-event rate is not necessarily a purchase-only rate.
Keep these possible labels separate: order density means distinct eligible orders÷eligible sessions; session purchase rate means eligible sessions with a purchase÷eligible sessions; purchasing-user fraction means distinct eligible purchasing users÷eligible users. The last is a custom population definition here, not a claim that a native default user metric uses your chosen identity or filters.
GA4 engagement rate is another measure. An engaged session can qualify through duration, a key event or multiple page/screen views; it does not require a paid order. Never replace missing purchase evidence with that rate. The broader metric-definition guide covers other campaign measures.
Before dividing, fix the date interval and zone, session/user identity rules, qualifying order status, refund cutoff, attribution/association rule, filters and whether paid and organic delivery can actually be split. Google’s attribution settings distinguish event-scoped credit from session/user sources and define touch lookback. A lookback is not the observation period for every person who saw a video.
A missing or zero denominator leaves the rate undefined. A verified zero numerator over a positive, eligible denominator can be zero; an unavailable purchase report cannot. Keep incomplete coverage and unjoined orders visible instead of making an attractive percentage from the remaining records.
Work one fictional cohort in three ways
Everything below is invented: no creator, analytics property, customer or campaign result was inspected. Imagine one organic placement reviewed for November 1,2026 00:00 UTC inclusive to November 8 00:00 UTC exclusive. The fictional native report has 20,000 plays with repeat plays included; unique viewers are unavailable. A separate exact website cohort has 400 eligible campaign-associated sessions from 300 distinct users. It includes eligible return sessions under its stated association rule, not 400 verified new link clicks.
For this illustration only, valid user/session identifiers join 12 distinct eligible paid orders to 10 of those 400 sessions, belonging to 9 of the 300 users. The order rule excludes tests, cancellations and full refunds through December 8,2026 00:00 UTC. Partial refunds are retained for the count and would separately reduce financial revenue. A code-only order lacking a website-session join is outside this particular conversion cohort and stays in a separate reconciliation question. No person-level video-exposure join exists.
| Requested figure | Arithmetic in this fictional record | Honest interpretation |
|---|---|---|
| Views→visits | 400÷20,000×100=2 sessions per 100 reported plays | A descriptive count yield for these declared reports. Not 2% of viewers visiting, not link CTR and not proof 400 people saw the video. |
| Visits→orders | 12÷400×100=3 orders per 100 sessions | Order density. The distinct orders are joined to this session cohort; some sessions contain more than one order. |
| Visits→a purchase session | 10÷400×100=2.5% | Session purchase rate under the invented purchase/status/window rule. This is not 12 events divided by 400. |
| Users→purchasers | 9÷300×100=3% | Custom purchasing-user fraction. Different unit from the 2.5% session rate despite using the same underlying orders. |
| Views→orders | 12÷20,000×100=0.06 orders per 100 reported plays | A descriptive associated-order yield. The percentage of exposed people who bought is unknown because eligible unique viewers and their join are missing. |
The first and last yields do not establish a view-to-visit-to-purchase people funnel. They compare campaign counts with declared units; they cannot show how many viewers failed to act. The arithmetic (400÷20,000)×(12÷400) reproduces 12÷20,000, but algebra supplies no missing identity linkage or causal evidence. If a client asks “what percentage of viewers bought?”, answer unknown from this record.
One extra order makes the distinction visible. If it comes from an already purchasing session, order density becomes 13÷400×100=3.25 orders per 100 sessions while the session purchase rate stays 10÷400=2.5%. A higher event/order density does not necessarily mean more sessions or people converted. These are teaching numbers, not expected rates.
Real data needs its own reconciliation. Google’s transaction-ID guidance describes purchase-event deduplication and requires unique order IDs; it also gives Firebase SDK instructions for sending IDs on app streams. That does not merge independent exports or prove an order-to-session join in your setup. Use the one-order guide before treating code and link records as separate purchases.
The manual rate record and separate blank CSV let you write the source counters, eligible cohort, publishable label and missing evidence for each of the three questions. They collect nothing and provide no automatic calculation or saving.
When enlarged, scroll horizontally to read the diagram.
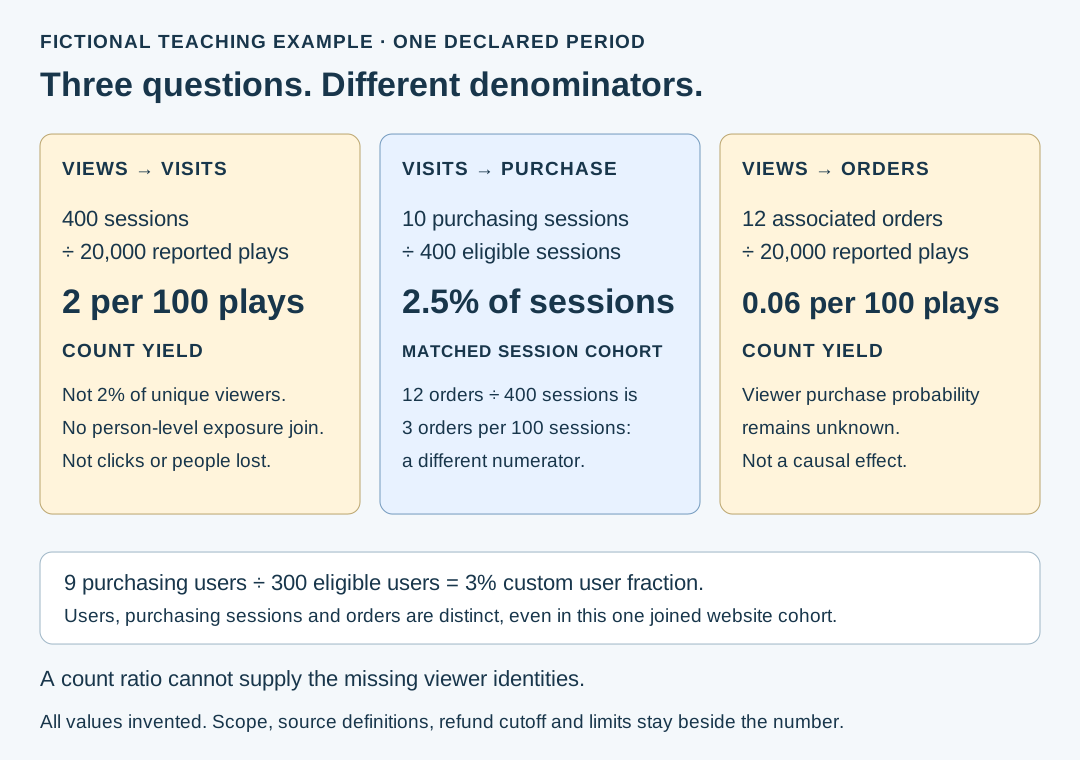
Original fictional teaching diagram; no measured campaign or account result.
Original visual by Superdirector editorial team. Creation date not recorded.
Check a proposed benchmark against its actual population
Before comparing a percentage, obtain the original report, its date, numerator, denominator, eligible population, country/market, collection period and per-campaign followup. Then check paid/organic scope, platform/format, product or lead definition, filters and attribution rule. A survey about what respondents say motivates them is not an observed purchase conversion rate.
For example, the retained Total Product Marketing page points to First Page Sage’s original agency report. The latter defines hard lead actions such as trials, demos, forms and calls relative to unique visitors. That is not a percentage of creator-video viewers who placed ecommerce orders. The read text does not establish a country and campaign-specific followup matching our fictional cohort. No percentage from it is adopted as a target here.
The complete impact.com guide discusses consumer attitudes and possible content actions; the complete Club guide moves between follower and view examples. Their questions are useful, but their claims do not make different denominators interchangeable. No claim that smaller creators, a discount or a format guarantees a higher conversion rate is established here.
For your own comparisons, use the same definition and equally mature cohorts, with the underlying counts beside the percentage. Do not average displayed rates across creators: combine compatible numerators and denominators only when they count the same thing, and retain any repeated-person or overlapping-session scope. A smaller denominator or an immature window can change a rate without improving the customer experience.
Choose a repair from the first unsupported rate
- If view units, paid/organic scope or placement dates are missing, request that report definition. Leave viewer-conversion claims uncalculated.
- If sessions and clicks disagree, use the GA4 source-versus-click guide; do not call their difference a loss rate.
- If orders cannot join to eligible sessions, retain them as separate business evidence. Resolve identities and code/link overlap before computing a session purchase rate.
- If counts are complete but comparisons are unlike, align definitions and followup before ranking creators. Keep reported paid and organic figures separate using the delivery-scope guide.
- If a valid rate still leaves the buying decision open, inspect the relevant product, offer or path evidence and choose one bounded next test. The rate alone does not identify a cause or predict the benefit of a change.
Finish with a sentence another reader can reproduce: “For [cohort/window], the source records [count and unit] over [denominator and unit] under [rule]; this answers [question], while [missing conclusion] remains unknown.” Give the missing item an owner and a date. Use the ROI walkthrough when the next question is financial return, not a percentage of sessions.
Superdirector can support upstream content planning around that question. The native analytics, identity and order records remain the evidence for these counters; no automatic sales verification or conversion improvement is promised.
Sources and limits
Three complete retained anatomy pages and the linked original agency report were read before drafting. Five complete Google primary pages support the narrow session, event, identity, engagement and attribution distinctions. Shopify help-report endpoints refused access and were not counted read; no account-specific Shopify conversion definition is inferred. Sources were read November 5,2026,Pacific time, with actual UTC captures retained.
The source records are research materials, not this publisher’s campaign evidence. No current exact-FAQ benchmark, ranking, original comparable conversion average or causal campaign result is established. The fictional cohort, rate-label decisions, worksheet and diagram are original editorial designs. No browser, account, commerce or analytics trial was performed.