How-To Guide
Influencer marketing metrics: choose units before formulas
Define influencer metrics by source, unit, window and denominator. Work through fictional clicks, sessions, orders and cost rates without double counting.
By the Superdirector editorial team. Reference texts reviewed November 5, 2026.
At a glance
Which influencer marketing metrics should a brand track and how should they be calculated?
Track metrics that can inform the next campaign decision, with the source, record unit, time window and missing-data state attached. Keep exposure, interaction, traffic and business records separate. For a rate, define the numerator and denominator before calculating; for a count, say what one record means. A shared label such as “view” or “conversion” is not enough to make two reports comparable.
- A click, session, order and customer are different units.
- Code, link and assisted-sales evidence may overlap on one order.
- Use the original metric card to record formulas, scope and unknowns.
Choose the number that changes a decision
Influencer marketing metrics are useful when they answer a defined question: did the content reach the intended audience, prompt a relevant action, or accompany a verified business outcome? A long dashboard can contain all three without showing how any one number was collected. Start with the decision, then attach the measurement definition.
Use the campaign objective guide to choose the strongest outcome you can actually observe. This page handles the next task: defining the counts and denominators so the report does not mix different things. The editable metric card and blank CSV provide an original manual worksheet, without data collection, formulas or automatic saving.
CreatorIQ and Superfiliate organize metrics around campaign goals. That broad structure is useful, but vendor guides are not neutral benchmarks. We use native documentation for the narrow platform definitions below and label the remaining calculations as explicit reporting choices.
Ten metric choices, with the unit still attached
These are ten common reporting jobs, not ten mandatory KPIs. A small campaign may need one primary outcome and a few diagnostic counts. Exact native labels and access can change; preserve the report definition you actually received rather than assuming a cross-platform equivalent.
| Metric | Source and calculation | What to keep visible |
|---|---|---|
| 1. Views | Creator/platform report; count at its native play/view definition. Preserve organic/paid and repeated-play scope. | A view is not necessarily a unique viewer. Do not blend unlike platforms or historical definitions. |
| 2. Reach | Creator/platform report defining people, accounts or another deduplicated unit over a stated scope. | Two post-level reach counts can include the same account; their sum is not unique campaign reach. Impressions are a separate display count. |
| 3. Saves | Native count of the stated save action. If using saves per reach, calculate saves ÷ compatible reported reach × 100. | This is actions per 100 reach units, not necessarily the percentage of unique people who saved; source rules decide uniqueness. |
| 4. Shares or sends | Native action count; name exactly which actions are included. Any rate needs its chosen, matching denominator. | A send, share or repost may be a different action. Do not sum overlapping native categories or call them orders. |
| 5. Destination click-through rate | Compatible destination link clicks ÷ eligible impressions × 100, when both come from the same stated placement report. | Name link clicks rather than all engagements. A native thumbnail CTR can answer a different question. |
| 6. Code-associated orders | Order/commerce authority; distinct eligible order records using the stated code under the campaign rule and window. | A code occurrence is evidence on an order, not a causal finding. Deduplicate code and link records before counting. |
| 7. Assisted-sales evidence | A defined association field on already reconciled orders, such as a qualifying earlier touch or recalled exposure under your rule. | State the rule and overlap with other credit. Do not add an assisted count to the same total orders. |
| 8. Cost per thousand defined views | Verified included cost ÷ compatible reported views × 1,000, with currency, view definition and paid/organic boundary. | Do not label this CPM on impressions. Production, creator, media and other cost inclusions must be explicit. |
| 9. Share in the intended market | Matching in-market units ÷ declared eligible geography units × 100, only if the report supports that population. | Say whether the unit is accounts, viewers, views or watch time; retain unknown geography and coverage. |
| 10. Repeat-purchase rate | Eligible customers with a subsequent qualifying purchase ÷ customers whose stated followup is complete × 100. | Define customer identity, qualifying purchase/refund rules, initial cohort and equal followup. Orders and customers are different denominators. |
Read a native definition before importing the number
YouTube’s video-content guidance defines thumbnail impressions and the subsequent viewing CTR; those impressions do not include external sites or apps. That CTR is not automatically an outbound destination-click rate. The same guidance describes average view duration at selected filters and recommends comparing like content formats. Use watch duration to investigate a viewing question, not as a sales count.
Google defines a session as grouped website or app interactions. It is a countable visit unit, not minutes of time on site. GA4 engagement rate uses engaged sessions, with criteria involving duration, a key event or multiple page/screen views. It is not the same formula as likes, saves or shares divided by followers or reach.
Google’s recommended-event reference distinguishes a submitted request, a qualified lead, a purchase and a refund. Those recommended events need implementation; a familiar event name does not verify the collection or the underlying CRM/payment record. Keep test records out of the campaign result.
Name the denominator before judging the rate
“Engagement rate” without a formula is incomplete. A follower denominator asks about actions relative to an account’s follower base; a reach denominator asks about actions relative to the source’s reached population. Neither is interchangeable with a view denominator. Record the included actions as well: likes plus comments differs from likes plus comments plus saves and shares.
Keep missing or zero denominators undefined. Zero saves divided by a verified positive reach can be zero; an unavailable reach report cannot supply that rate. A creator with a newer post also needs the same elapsed observation window before comparison. Do not improve comparability by silently filling missing cells with zero.
When combining compatible rates, work from their underlying numerators and denominators rather than averaging displayed percentages. Even then, name the aggregate unit. Adding two posts’ reach denominators gives post-level reach units, with possible repeat accounts; it does not deduplicate the campaign audience.
Fictional audit: clicks, sessions, orders and cost
Every number in this exercise is invented. There was no campaign, account trial or customer result. Suppose a brand reviews one creator campaign for November 1, 2026 00:00 UTC inclusive through November 8 00:00 UTC exclusive. Its source files cover that same window, with test traffic excluded and paid/organic scopes recorded separately.
| Invented source | Value and unit | What can be calculated or concluded |
|---|---|---|
| One placement report | 2,000 eligible impressions and 40 destination link clicks | 40 ÷ 2,000 × 100 = 2% destination CTR for that placement and definition. |
| Website analytics | 32 tagged sessions in the same window | 32 sessions were reported under the tag. It does not prove that exactly 8 of the 40 clicks were lost or that all 32 sessions came from distinct people. |
| Reconciled commerce ledger | 9 qualifying paid orders under the declared campaign association rule | Report 9 associated orders, after source reconciliation. Code, link and assisted evidence remain fields on these same orders; they are not new totals to add. |
| Defined creative-view report and cost record | 18,000 reported views; 900 USD included cost | 900 ÷ 18,000 × 1,000 = 50 USD per thousand defined views. The report is not using impressions for this rate. |
For the cost rate, imagine the 900 USD comprises 600 USD creator/production and 300 USD paid distribution, under a documented scope matching the 18,000-view report. Those are invented amounts, not fees or benchmarks. If a platform cannot supply a defensible paid/organic view split, retain that limitation; do not subtract a later cumulative snapshot to invent it. If additional material costs are excluded, label this a partial-scope rate.
The 2% CTR and 50 USD view-cost rate describe different relationships. Dividing 9 orders by 32 tagged sessions would produce a tempting percentage, but it is not a verified session-to-order conversion rate unless those orders are actually joined to that eligible session cohort under a declared rule. The campaign-level association alone does not establish that join. A code sale may arrive through another route.
Use the one-order reconciliation guide before reporting the order total, and the UTM guide for traffic labels. This exercise assumes those source tasks are done; it does not replace their implementation.
When enlarged, scroll horizontally to read the diagram.
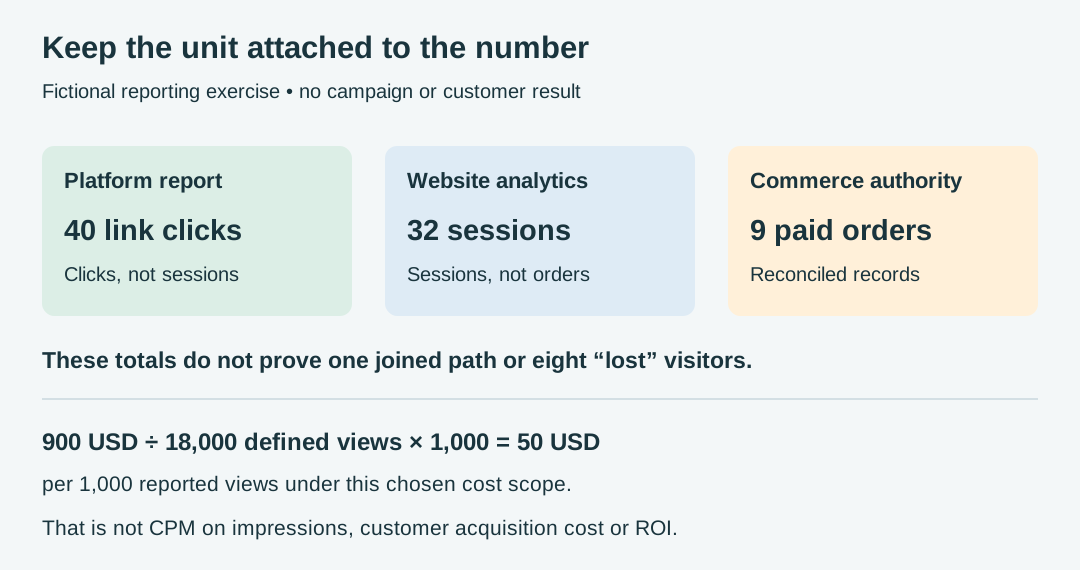
Original fictional unit audit. The counts do not establish a joined conversion path; the cost rate uses a stated view and cost scope.
Original visual by Superdirector editorial team. Creation date not recorded.
Do not turn a geography excerpt into the whole audience
YouTube’s audience documentation says some audience information may be limited and describes top geographies by channel watch time. If that is the report you have, a country share describes watch time under its scope. It cannot be relabeled as a percentage of the creator’s followers or people reached.
For a separate fictional account-based report, imagine 100 reported account units: 60 confirmed in-market, 20 confirmed elsewhere and 20 with unknown geography. In-market share among known geography is 60 ÷ 80 = 75%. Confirmed in-market share of all reported units is 60 ÷ 100 = 60%. These answer different questions. With only those classifications, the total in-market share could lie between 60% and 80%; the unknown 20 are not automatically outside the market. This arithmetic is a teaching bound, not a claim that a native platform exposes this exact report.
Ask for the source’s denominator, extraction date and any hidden or unreported categories. If the report supplies only top countries without a matching total, keep the whole-audience percentage uncalculated instead of treating the excerpt as complete.
Give repeat purchase an equal chance to occur
A repeat-purchase measure needs a customer cohort and a complete followup, not merely an order count during campaign week. Define the first qualifying purchase, customer identity, later qualifying purchase, cancellation/refund treatment and how long each customer is observed. Keep source-system identity and campaign association separate from a claim of creator causality.
Continue the invented exercise with 8 distinct first-time customers whose first purchases fell in that campaign window. Suppose all 8 have a complete 14-elapsed-day followup by the November 22 UTC review, and 2 made a subsequent qualifying purchase after that campaign week and within their own 14 days. The observed repeat-purchase rate for that defined cohort is 2 ÷ 8 × 100 = 25%. This is not 2 divided by 9 orders. If some followups were still incomplete, state the mature denominator and pending customers rather than giving recent customers less time.
This 25% is not a benchmark, forecast, lifetime-value estimate or causal effect of a creator. It is a fictional illustration of how the denominator changes the question.
Use one card per meaning, not one column per label
- Write the campaign decision and the source that can actually answer it.
- Name the record unit, included actions or outcomes and the post/account/placement scope.
- Define numerator and denominator, or mark a count’s denominator not applicable. State rounding and how missing data stays unknown.
- Freeze the window and capture time; separate organic, paid and repeated cumulative observations.
- Attach the source reference, cost scope if relevant, association rule and interpretation limit.
- Report the result with its uncertainty and one next decision. If a definition changes, date the revision rather than merging unlike periods.
The campaign spreadsheet stores the underlying records. This metric card defines what a reporting column means. A CRM, platform report, order authority or payment record remains the source of the fact; a planning sheet should not become a competing business system.
Keep cost efficiency separate from financial return
A low cost per view can coexist with no verified sales. Associated revenue divided by ad spend is also different from profit after all relevant costs. Use the ROI guide when the return, cost scope and business records are available. If those inputs are missing, report the supported metric and leave financial return uncalculated.
Superdirector can support upstream content planning around the chosen objective. The actual platform, analytics, CRM, customer and cost records still supply the evidence for these metrics. No score or planning tool turns an unobserved order or missing denominator into a verified result.
Sources and scope
Seven complete external texts were read on November 5, 2026: two vendor guides, two YouTube pages and three Google Analytics pages. The session definition was also read in full. The retained November 3 keyword answers show dated citation examples, not a current ranking or a demand census. No live native account, analytics-property, campaign or spreadsheet trial was performed. The metric card, formulas with stated assumptions and fictional exercises are original editorial material. No engagement, cost, return or retention value is presented as our result.