How-To Guide
Which influencer marketing statistics can a brand trust, and where do they come from?
A dated ledger of influencer marketing statistics from IAB, the ASA and peer-reviewed research, labelled by type, with how to trace and cite each.
By the Superdirector editorial team. Sources read November 6, 2026.
At a glance
Which influencer marketing statistics can a brand trust, and where do they come from?
Trust statistics you can trace to whoever measured them, with a stated method, sample, place and date: ASA disclosure monitoring, the 2024 JAMS meta-analysis and IAB's creator ad spend report qualify. Treat vendor and publisher surveys as what respondents said. Do not repeat a number you cannot trace past a roundup.
- IAB: US creator ad spend projected at $37 billion in 2025, counting intentional brand ad spend.
- ASA: about 57% of influencer ads in its 2024 UK sample followed disclosure rules.
- JAMS meta-analysis: 1,531 effect sizes from 251 papers (October 2024).
Trust a statistic you can trace to its method, sample and date
Trust the numbers you can trace to the organisation that measured them, with a stated method, sample, place and date. Regulator monitoring, peer-reviewed research and trade-body reports that publish their methodology are the safest. The ASA's 2024 disclosure report, the 2024 meta-analysis in the Journal of the Academy of Marketing Science and the IAB's creator ad spend report all do this. Treat vendor and publisher surveys as reports of what their respondents said, not as market facts. Do not repeat a number you cannot trace past a roundup.
Below is a dated ledger of public influencer marketing statistics, each linked to the original and labelled by type. Every figure was read on its source page on November 6, 2026.
Use this dated ledger of statistics and their sources
| Statistic | Type | Who measured it, where, when | What it counts |
|---|---|---|---|
| US creator economy ad spend projected at $37 billion in 2025, up 26% | Trade-body projection | IAB, US, November 20, 2025 | Ad dollars brands intentionally put into creators; excludes affiliate, subscriptions, tips and merchandise |
| Creator ad spend rose from $13.9B (2021) to $29.5B (2024) | Trade-body estimate | IAB, US, 2025 release | Same definition as above |
| US creator ad spend expected to reach $44 billion in 2026 | Trade-body forecast | IAB, US, 2025 report page | Same definition as above |
| 48% of ad spenders consider creators a must buy; 40% rank ROI as top KPI | Survey of ad buyers | IAB, US, 2025 release | Shares of the ad buyers IAB surveyed |
| About 57% of influencer ads followed disclosure rules; 34% had no disclosure; 9% used unclear labels | Regulator monitoring | ASA, UK, published May 9, 2025 (2024 monitoring) | An automated scan of over 50,000 pieces of content from 509 UK-based accounts, with an expert-reviewed sample; accounts included previously flagged influencers |
| 1,531 effect sizes from 251 papers on what drives influencer effectiveness | Peer-reviewed meta-analysis | Pan, Blut, Ghiassaleh and Lee, Journal of the Academy of Marketing Science, October 12, 2024 | Published studies measuring consumer attitudes, behavioural engagement, purchase intention, purchase behaviour and sales |
| Budgets, KPIs and creator tiers from a 2026 survey of marketing professionals (the report cites 600+ respondents) | Publisher survey | Influencer Marketing Hub, 2026 benchmark report | Respondents who answered each question; multi-select answers |
The CSV version adds the exact source URL and a column for the date you last checked it.
Label every number by the kind of evidence it is
- Regulator monitoring: the ASA looked at real posts and counted. Strong on method, but limited to its sample. Its 2024 sample deliberately included influencers flagged before, so 57% compliance is not a UK-wide rate.
- Peer-reviewed research: the JAMS meta-analysis pools 251 published papers. It is the best evidence on what drives results, but Big Bang Story's summary points out that "a meta-analysis inherits the biases of what it pools", and sales outcomes are studied far less than attitudes.
- Trade-body estimates: IAB's spend figures come with a published definition. Use them with that definition attached.
- Surveys: a share of respondents, not of the market. IMH's report says its percentages "are calculated among respondents who answered that question". IAB's 48% "must buy" figure is also a survey result.
- Vendor case figures: one brand's result reported by the vendor that sold the tool. Useful as an example, not as a statistic.
The trust-check diagram puts these in order, from most to least checkable.
When enlarged, scroll horizontally to read the diagram.
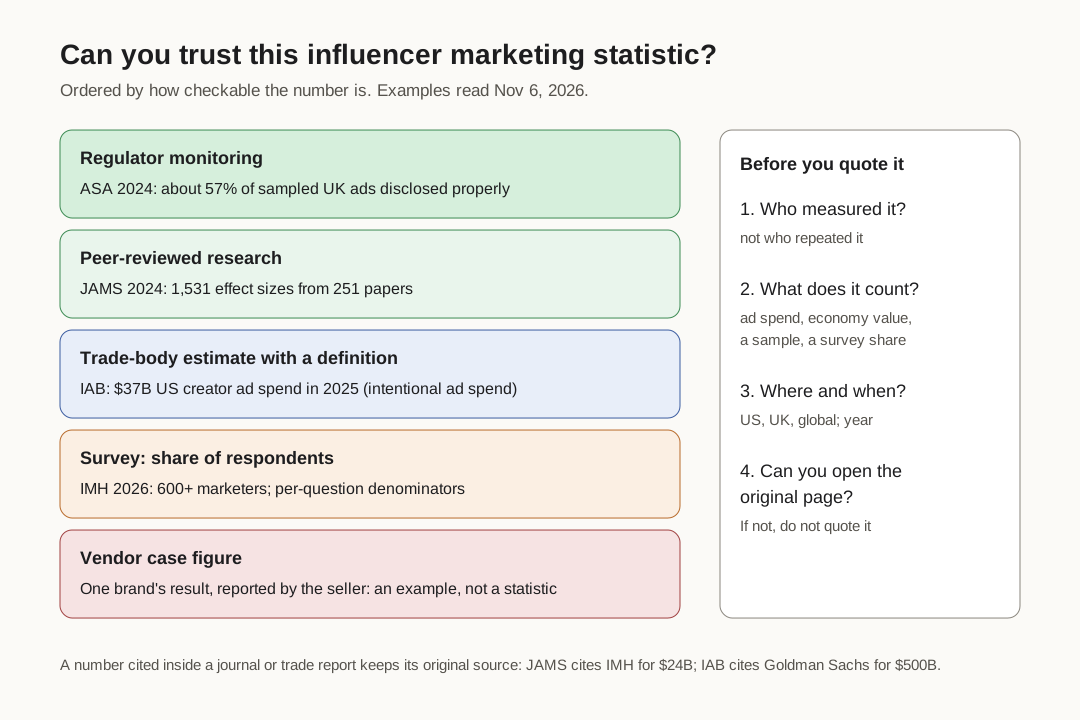
Original editorial diagram. The ordering is about how checkable a number is, not whether it is true.
Original visual by Superdirector editorial team. Creation date not recorded.
Trace a number back before you quote it
Influencer statistics travel. A figure starts in one report, gets cited by another, and ends up in a roundup with no method attached. Two examples from today's reading:
- The JAMS meta-analysis opens by noting that spending on influencer marketing "surged to $24 billion in 2024". It credits that to the Influencer Marketing Benchmark Report, a publisher's estimate. Seeing the number in a journal does not make it a journal finding.
- The IAB's November 2025 creator showcase quotes eMarketer's projection of $10 billion for US social sponsored content in 2025, and Goldman Sachs's $500 billion creator economy valuation by 2027. Those are eMarketer's and Goldman Sachs's numbers, so cite them as theirs.
Market-size numbers also measure different things. IAB counts intentional brand ad spend on creators and says other estimates also add affiliate links, subscriptions, tips and merchandise. A $37 billion figure and a $500 billion figure are not a contradiction. They count different things.
Cite statistics in a plan or pitch like this
- Name who measured it, the place, the year and the type: "IAB projection, US, 2025".
- Link the original page, not the roundup that quoted it.
- Keep the definition with the number ("intentional brand ad spend").
- For surveys, give the sample and say it is a share of respondents.
- Recheck the page before you publish; reports get updated.
Industry numbers say little about your own campaign. The IAB itself says creator advertising "still lacks the measurement standards, currencies, and financial rigor" needed to fold creators fully into enterprise media plans, according to its January 2026 measurement report. For your own results, measure them: our influencer marketing metrics guide and return on investment guide cover how. If you are checking disclosure on your own creator posts, see reviewing a creator's disclosure caption and video.