How-To Guide
How do you calculate an influencer’s average views, and which average should you trust?
Calculate an influencer’s average views from 12 to 20 like-for-like organic posts, report the median beside the mean, and price on cost per 1,000 views.
By the Superdirector editorial team. Platform help pages, Meta, NIST, arXiv and vendor pages read October 31, 2026.
At a glance
How do you calculate an influencer’s average views?
Take the view counts of the creator’s last 12 to 20 organic posts in one format, leave out posts that were paid, boosted or contests, and sort the rest. The median, the middle post, is the typical figure. The mean, total views divided by the number of posts, is a second number to show beside it, and when it sits far above the median a few hits are carrying it. Divide the quoted base fee by the median views in thousands to get a cost per 1,000 views, and record the platform’s view definition and the date you pulled the counts.
- A calculator labelled average views may return a median: HypeAuditor’s page says its figure is the median of recent Reels after outlier removal.
- In this page’s fictional sample the mean is 3.3 times the median because one of 20 posts reached 412,000 views.
- YouTube counts views from the first frame across all formats from August 24, 2026, so a list that crosses that date holds two kinds of count.
The short version: median first, mean beside it
Short answer: to find an influencer’s typical views, list their last 12 to 20 organic posts in one format, sort the view counts and take the median, the middle post. Work out the mean too (total views divided by the number of posts), but show it beside the median and never alone. If the mean is much higher, one or two hits are carrying it, and the median is the number that says what an ordinary post gets. Then divide the fee you were quoted by the median views in thousands to get a cost per 1,000 views that you can set beside another creator’s.
This is for a brand marketer who has a creator’s handle and a quote and needs one honest number. Most pages called an “average views calculator” are a box that returns a figure without saying whether it is a mean, a median or something trimmed, and the next section shows two that differ. The arithmetic takes a minute. What changes the answer is which views you count, which posts you keep and which average you report, and the five steps below settle those in that order. Use the original chart of one fictional 20-post sample and the blank average views worksheet; the worksheet holds no creator, view count or fee.
Why “average views” calculators give different answers
We read two vendor pages on October 31, 2026. HypeAuditor’s Instagram average views calculator says its average views is the median views of recent Reels after outlier removal, and it gives no thresholds for what it removes. The page describes the posts it reads as the last 12 in one place and as recent Reels in another, and says it excludes feed videos and Stories. Admanage’s TikTok guide defines average views as total views divided by the number of posts and offers a calculator that returns the mean and the median together. Its own example, nine posts at 1,000 views and one at 91,000, gives a mean of 10,000 and a median of 1,000. One tool’s “average” is therefore a median of Reels with unnamed trimming, and another’s is a plain mean. Two numbers with the same label cannot be compared until you know which statistic and which posts sit behind each.
The case for the median is old statistics, not a platform rule. The NIST engineering statistics handbook says that for data with extreme values in the tails the median is a better estimate of location than the mean, and it lists the trimmed mean, which commonly cuts 5% of the points from each tail, as another measure that extremes do not unduly move. NIST: measures of location. Video views are a natural home for extreme values: a study of about 10 million YouTube view time series found that the fluctuations around the average views are themselves heavy tailed, which fits big hits being a normal part of the data. Miotto, Kantz and Altmann, arXiv 1609.06399. That study covers YouTube videos in general, not sponsored posts or any influencer tier, so it explains why to expect a skewed list and not how skewed yours is.
Decide which view count you are measuring
A view is not one thing across platforms, and the rules have changed recently. This is what the sources we could read say.
| Where | What the source says a view is | Catch |
|---|---|---|
| Instagram Reels and videos | Meta announced on November 14, 2024 that Facebook Plays on reels and videos would be called Views, calculated the same way across Facebook and Instagram, and said how Views are calculated would not change. Its developer reference defines the media views metric as total plays and says interactions on ads are not counted. (Meta announcement, developer reference) | HypeAuditor’s page says a view needs at least 3 seconds; Meta’s lines we read state no minimum. Do not assume two tools count alike. |
| Instagram Stories and photos | Views count each time the post appears on a screen, repeats included. (Meta announcement) | Not a count of people, and Stories leave the public profile, so you cannot calculate from it later. |
| YouTube Shorts | A view counts each time a Short starts to play or replays, from March 31, 2025; the old measure became “engaged views”. (TechCrunch) | Counts before that date used a different rule. |
| YouTube long-form and live | Beginning August 24, 2026, views are counted the moment a video starts to play across all formats. (YouTube Help) | The page does not say whether counts already on older videos were restated. |
| TikTok | In ads reporting, video views are the times a video started to play, with replays excluded per impression. (TikTok Ads Help) | That page is about advertiser metrics. We found no readable TikTok page defining the public count, and third-party explainers disagree. |
Three consequences follow. One platform and one format per calculation: a Reel and a feed photo, or a Short and a long video, are different counts. Write the definition and the pull date on the sheet: YouTube’s page says it may temporarily slow down, freeze or change a metric count and discard low-quality playbacks while it checks accuracy, so a number you pull today can move. And treat a rule change as a seam. A creator who posts weekly has only about ten long videos between August 24, 2026 and the publication date of this page, so a 20-video YouTube window usually crosses it. Because neither source we read says older counts were restated, either keep that window to videos after the date and call it a sketch, or split the list at the date and label both halves.
Pull a clean list of recent posts
List the creator’s last 12 to 20 public posts in the one format you would buy. The window is a judgement. The vendor pages we read give different ones and none tests which predicts best: HypeAuditor’s page mentions the last 12 posts, a whynotviral guide uses the last 20 public videos, and Admanage suggests the last 10 to 20 comparable videos. With fewer than ten posts the median shifts with every post you add, so call it a sketch.
- Leave out paid and boosted posts. Meta’s developer reference says the views metric excludes interactions on ads, and Admanage says to keep paid promotion out of organic averages. A post run as an ad has plays you cannot price as organic.
- Leave out contests and giveaways, which collect views for a prize and are not what an ordinary post does. This is our judgement, so write the reason in the flag column.
- Leave out posts that have not matured. A post from yesterday is still collecting views. Admanage suggests comparing posts at the same age, such as seven days after posting; we found no test of that, so pick a minimum age and apply it to every creator you compare.
- Do not delete the viral post. A hit is real evidence that the audience can deliver upside, and removing it by hand is a decision you would have to defend. Leave it on the list and let the median handle it.
For each post record the date, the link, the views and the date you pulled them. If the metric is not public, as with Stories or a hidden count, ask the creator for screenshots of their own insights that cover the same dates, and mark those rows “creator-supplied” because you cannot check them yourself. A count is also only as good as the account behind it; the fake-follower check covers whether the audience is real.
Calculate the mean, median and trimmed mean
Put the views in one column and use three spreadsheet formulas. NIST defines the mean as the sum of the data points divided by their number and the median as the middle value, and describes a trimmed mean that cuts a share of points from both tails. Microsoft’s documentation for TRIMMEAN says its percent argument is the fraction of data points to exclude in total, half from each end, rounded down to a multiple of 2, so 0.1 on 20 points drops the highest and the lowest post. Microsoft: TRIMMEAN.
=AVERAGE(G2:G21)       mean
=MEDIAN(G2:G21)        median
=TRIMMEAN(G2:G21, 0.1) trimmed mean, 20 posts
=MAX(G2:G21)/MEDIAN(G2:G21)   largest post as a multiple of the median
Fictional example: no real creator or account was measured. Twenty organic Reels, oldest to newest, each at least seven days old, drew 8,600; 7,300; 9,900; 5,200; 412,000; 12,400; 6,900; 9,100; 4,200; 11,300; 8,200; 16,900; 6,400; 9,400; 3,100; 13,800; 7,800; 21,500; 5,900 and 10,600 views.
| Measure | How it is worked out | Result |
|---|---|---|
| Mean | 590,500 total views ÷ 20 posts | 29,525 |
| Median | Sorted, the 10th and 11th posts are 8,600 and 9,100; their average | 8,850 |
| Trimmed mean | Drop 3,100 and 412,000, then average the other 18 | 9,744 |
| Mean without post 5 | 178,500 ÷ 19 posts | 9,395 |
| Largest ÷ median | 412,000 ÷ 8,850 | 46.6 times |
| Posts at or above the mean | Only post 5 (412,000); the next highest is 21,500 | 1 of 20 |
A report that says this creator averages 29,525 views is arithmetically right and describes none of the posts except one. Nineteen of twenty sit between 3,100 and 21,500. The chart below shows the same list with the mean and median drawn across it.
When enlarged, scroll horizontally to read the diagram.
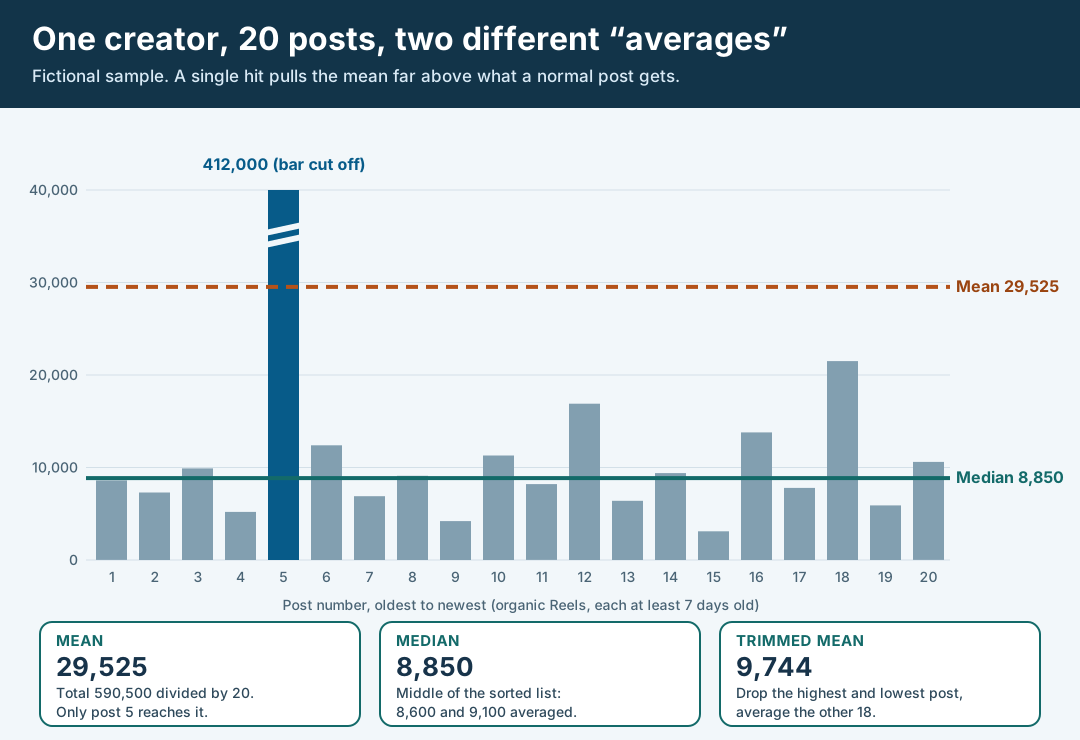
An original editorial chart of a fictional 20-post sample. It shows how one hit moves the mean, not any real creator’s views.
Original visual by Superdirector editorial team. Creation date not recorded.
Read the gap between the mean and the median
Divide the mean by the median. In the sample that is 29,525 ÷ 8,850, about 3.3. We found no published threshold for when a gap matters, so the following is our working rule and not a standard: if the mean is more than about 1.5 times the median, look at the top posts before you use any number. A gap usually has one of three causes, and each calls for something different.
- One or two hits. This is post 5. Keep it on the list, plan and price on the median, and note the hit as evidence of upside you are not paying for.
- A trend. If the newest posts are all higher or lower than the oldest, one median across the window blends two different accounts. Compare the median of the older ten posts with the median of the newer ten. In the sample they are 8,850 and 8,800, so there is no trend to chase. If they split widely, use the newer half and say why.
- A mixed list. Two series, two on-camera people or a run of giveaways can create two clusters of views. Sort the counts and look for a break in the middle of the list, then split by series and calculate each on its own.
Use the trimmed mean as a cross-check, not a third opinion. Here it is 9,744 against a median of 8,850, so cutting the extremes confirms that a typical post is in the high single thousands. If the trimmed mean and the median disagree by a lot, the middle of the list is itself uneven, and you should read the sorted views before going further. The glossary entry on engagement rate covers what viewers do after watching, which no view average captures.
Turn typical views into a cost per 1,000 views
Cost per 1,000 views is the base fee divided by typical views in thousands: fee ÷ (median views ÷ 1,000). Suppose the creator in the sample quotes $350 for one organic Reel, a fictional figure. At the median of 8,850 views that is $39.55 per 1,000 views. At the mean of 29,525 it would be $11.85, which makes the quote look 3.3 times cheaper than it is for an ordinary post. Nothing changed except which average went into the formula.
Two conditions keep the figure honest. The fee must be the base fee for organic posting, with usage rights, ads run through the creator’s handle and extras priced as separate lines; the benchmark guide shows how to put a quote on one standard deliverable, and the rates guide covers valuing the fee itself. And the result describes past posts. It is not a forecast, and we found no study that measures how well a creator’s past median predicts a sponsored post, so use it to compare creators and question a quote, not to promise an outcome. Follower count is a weaker guide than the median of the posts themselves; the influencer budget calculator prices from follower tiers and says so.
What the number cannot tell you
- Views are not people. Meta’s developer reference describes reach as the unique Instagram users who saw a reel at least once, and Meta’s announcement says Stories and photo Views include repeat views. A median of 8,850 views is not 8,850 people.
- Views are not proof the audience is real or in your market. A public count says nothing about where viewers live or whether plays are genuine. The partial geography guide and the vetting rubric cover those checks.
- Counts move after you pull them. Record the date, and pull every creator you compare on the same day.
- There is no benchmark band here. HypeAuditor’s page publishes low, average and high view bands by follower tier but shows no date for them, so we do not reproduce them.
Where Superdirector fits
Superdirector does not return an average-views figure for any handle on request, and nothing here says it replaces the worksheet. In a creator list, a result row shows the account’s followers and, when the saved list carries one, a typical views figure labelled as a median; where the run recorded none, the row says “Not recorded” and never shows zero. Read that figure as you would your own median: ask which posts and which definition of a view it rests on, because the row does not state the window. The shortlist guide shows how to check creators against the task before outreach. Check the available workflow and usage before requesting work.
How this differs from nearby pages, and what we could not verify
This page computes the typical views of one creator’s posts. The benchmark guide asks whether a fee is in line with published ranges, and the budget calculator applies follower-tier brackets. This is the step before both.
We could not read Instagram’s own Help Center pages, which returned only a heading, so the Instagram definitions rest on Meta’s announcement and developer reference. We found no TikTok page defining the public view count. Neither YouTube page we read says whether older counts were restated after August 24, 2026. The window sizes, the seven-day minimum age and the 1.5 times rule are vendor suggestions or our own judgement and none is tested. We make no claim about how views convert to sales, about AI-generated video or about any creator’s actual performance.