How-To Guide
How to read a creator report that lists only top audience countries
Interpret a creator’s top-country report without assigning unseen audience to the wrong market. Keep metric, scope, denominator and unknown share visible.
By the Superdirector editorial team. Official YouTube Analytics guidance reviewed October 29, 2026.
At a glance
How should a brand handle a creator report that lists only top audience countries?
Record the exact platform report, metric, period, content scope, filters, visible countries and any comparable total. Count listed brand-market rows as observed, listed other countries as observed, and the unlisted balance as unknown. Subtract visible rows from a total only when they share metric, unit, window and scope; otherwise do not calculate a remainder or percentage. State only the metric-specific bounds the report supports, then request a fuller same-metric view if the unknown share could change the market-fit decision. Do not call unseen countries foreign, zero, followers or buyers.
- Preserve the platform’s exact metric, date range, content scope, visible rows and any comparable total.
- Keep listed brand markets, listed other markets and unlisted remainder in separate buckets.
- Calculate same-metric bounds only when the denominator is valid; request fuller evidence if the decision stays open.
Direct answer
Direct answer: use the listed countries as observed rows for the exact metric and period shown. Do not turn the unlisted balance into zero, “foreign audience,” follower geography, or a buyer count. Record the platform and report title, metric and unit, date range, content scope, filters, visible country rows, and any comparable total. If the total and rows are truly from the same report and measure the same thing, subtract the visible rows to show an unresolved remainder; leave its country assignment unknown. Compare only the observed in-market and out-of-market amounts with the brand’s *declared* markets. Ask the creator for a fuller, permissioned report when that unknown part could change the decision. If the total, denominator or scope is missing, say that no share or remainder can be calculated from the screenshot.
This is a narrow reading task, not a universal creator score. The served Spanish-language cozy-game shortlist keeps language, creator location, audience geography and game-market fit separate. The served 100-point vetting rubric says a top-country report can leave geography unresolved. The served YouTube creator comparison guide keeps public views, engaged views and unique viewers distinct. This guide shows how to transcribe and reconcile one partial geography report, what lower and upper bounds its rows permit, and what to request next. Use the blank report-reading card, blank CSV, and known-versus-unknown map. They contain no real creator account or audience numbers.
Step 1: Name the brand question before reading countries
Write the market decision in a sentence before opening the report: “For this campaign, we need evidence about historical watch time from our declared markets,” or “We need the geography of unique viewers for content comparable to the proposed deliverable.” The brand must state its markets from its own commercial reality—where the product is available, language is supported, shipping or service exists, and the campaign is intended to run. Creator residence and content language do not substitute for audience geography.
Be precise about which audience concept matters. Followers or subscribers are account relationships; views count plays; unique viewers estimate people; watch time measures time spent watching. A report about one of these does not silently answer a question about another. YouTube’s Audience help defines “Top geographies” in the Audience tab as the places contributing the most watch time for the channel. The same help page separately defines monthly audience as unique viewers over a rolling 28 days and defines views and watch time as different metrics. A screenshot labeled “Top geographies” is not a census of subscriber countries, unique people, customers, or likely buyers.
The decision may also need a narrower content scope. A whole-channel report can include many formats and topics; a campaign may ask for a short review video or a live stream. If the report covers the channel, write “channel,” not “this sponsored post.” If the creator supplies a per-video geography report in a different YouTube view, use that view’s actual metric and selected period. YouTube’s limited-data guidance gives a geography example in Advanced Mode based on views for one video; that is not the same definition as the Audience tab’s watch-time-ranked Top geographies. The article and worksheet never substitute one for the other.
Output: a one-line question that names the desired metric and scope, a separate list of the brand’s declared markets, and an honest reason the answer would change the sourcing decision.
Step 2: Preserve the report’s metric, window and coverage
Ask for a creator-authorized export or a redacted screen that still shows the platform, report title, metric label, unit, selected start and end dates, content scope, filters and breakdowns, country rows, total if present, and any “top results only” or limited-data note. A crop that shows only country percentages without the title and denominator is inadequate for a quantitative market-fit claim. Redact account identity or commercially sensitive details with the creator’s permission, but do not crop away the fields needed to interpret the numbers. Store the original in the existing authorized campaign record and put a private reference in the worksheet; the public blank card is not a place to upload creator analytics.
Write down whether each row is an amount or a percentage, and what it is a percentage *of*. “United States 42” could mean 42 hours of watch time, 42 views, 42 percent of a defined total, or an unlabeled chart value. Do not choose a convenient interpretation. If the platform labels the metric “views,” preserve that word. If it labels it “watch time (hours),” preserve that phrase. If a third-party media kit renames a platform measure as “audience,” ask for the underlying platform report rather than reusing the media kit’s headline. The YouTube audience guide is a good example of why the labels matter: even within one analytics product it distinguishes unique viewers, subscribers, views and watch time.
Record the as-of time and report version. Note whether the report is channel-wide or for one video, and whether selected filters change it. Do not combine a country table from one date range with a total from another, or a channel total with video-level rows. If the row values are rounded percentages, a small difference from 100 may be rounding, not a known block of hidden people.
YouTube’s limited-data help warns that privacy or system limits can leave rows unavailable and that totals may differ from the sum of displayed rows. It also says a table may note that only top results are available. The exact suppression thresholds are unpublished and may change. A missing row is therefore not proof of zero. Yet a cropped screenshot alone also cannot prove that a particular missing country was suppressed: the crop, filters, report design, rounding or a top-N display might explain what is visible. Label the observed limitation instead of diagnosing its cause without evidence.
Output: a report-provenance line beside the data. Without it, the later arithmetic is merely a calculation on disconnected numbers.
Step 3: Separate visible markets from the unlisted balance
Transcribe every visible country row exactly as shown and map it against the brand’s declared market list. Put visible rows in one of two observed groups: listed in-market or listed other-market. If a row says “Other,” “Unknown,” or a regional aggregate rather than a country, preserve that label; it is not a named outside market. The calculation is about the report’s metric—watch time, views or another named measure—not about the number of people living in each place.
If the report supplies a same-metric, same-window, same-scope total, sum the displayed rows and subtract from that total. Call the difference unlisted or unresolved. Check whether the report uses rounded display values, a hidden row, “Other” category, different aggregation, or an export note before presenting the difference as exact. Do not invent countries for the gap. YouTube’s official limited-data example imagines a one-video Advanced Mode report with 1,000 total views, 500 visible U.S. views and 498 visible Canadian views; two views from France are included in the total but not displayed as a row. The help article reveals France to explain the mechanism. A person given only the displayed table would know two views are unlisted, not that they came from France. That example is about views, not the Audience tab’s Top-geographies watch time.
When the only source is a screenshot of the top rows with no comparable total, stop at “listed amounts observed; unlisted balance cannot be calculated.” If the screenshot gives percentages, a remainder from 100 is justified only when the report identifies those percentages as shares of the same complete denominator for the selected scope and period. A chart that normalizes only the displayed top countries would not justify that subtraction. If values are rounded, state an approximate or bounded remainder rather than writing a false exact fraction. The worksheet has a field for denominator status so the team can make the stop visible.
The unlisted balance is not necessarily small. Three impressive top rows can cover a minority of the total if many other countries are omitted. Conversely, visible rows alone may already establish a useful lower bound on a defined *metric share*. Neither condition follows from the rank labels; it follows from a valid total and the values. Keep an explicit three-part record: observed in-market, observed other-market, and unresolved. Never quietly move the third part into the second because the brand does not sell in the countries it can see.
Output: a reconciliation with the original unit still attached: for example, “66 hours of the same report’s watch time from listed brand markets, 24 hours from listed other markets, and 30 hours not assigned to a country in the supplied rows.” It does not say 66 people, 30 foreign followers or 30 lost sales.
When enlarged, scroll horizontally to read the diagram.
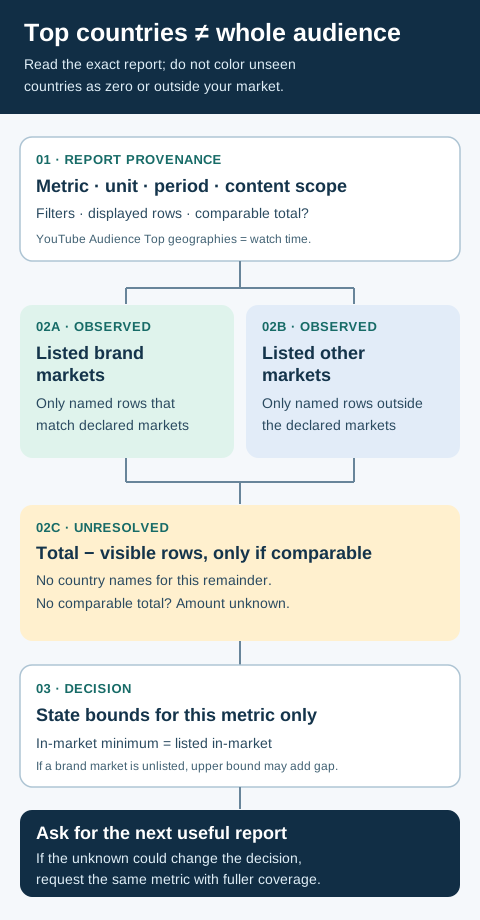
Original known-versus-unknown geography map. Unlisted rows remain unassigned; the drawing is not a country heatmap or a follower census.
Original visual by Superdirector editorial team. Created 2026-10-29.
Step 4: State a bounded conclusion, not a guessed audience
If a trustworthy same-report total exists, the visible in-market amount is a minimum possible in-market amount for that report’s metric. When one or more declared brand markets have no displayed row, the unresolved part could be in those markets, outside them, or split. The visible other-market amount is likewise a minimum for the other group. A conservative upper bound for in-market is visible in-market plus unresolved, and an upper bound for other-market is visible other-market plus unresolved. If the source establishes complete country values for every declared brand market and each is already listed, tighten the in-market bound to the observed sum instead of pretending the same country could reappear unseen. Divide by the same total only if it is truly the common denominator. These are arithmetic bounds, not a statistical confidence interval or a forecast.
Fully synthetic teaching example: imagine a creator-authorized channel watch-time report, with all rows and total measured over the same dates and filters. It shows 120 watch-time hours in total, with 48 U.S. hours, 18 Canadian hours and 24 U.K. hours visible. The brand has separately declared the United States, Canada and Australia as its campaign markets; Australia has no displayed row. The displayed countries sum to 90 hours, leaving 30 hours unresolved. The brand can say at least 66 of 120 hours, or 55%, came from its listed markets; at most 96 of 120 hours, or 80%, could have come from its markets if all 30 unresolved hours were Australian. It can also say at least 24 hours, or 20%, were in the listed U.K. row. It cannot say the other 30 hours were outside the market. It cannot say 55% to 80% of followers or unique people were in-market, because the invented report measures watch time. The numbers, brand and report are fictional; no creator account or campaign result was observed.
Suppose the fictional brand had declared 70% of historical watch time from its markets as a screening threshold before it saw the report. The 55%–80% range crosses that threshold, so the partial report does not settle this one question. A report with a lower bound already above a declared threshold could settle that metric-specific minimum despite missing rows. An upper bound below the threshold could settle that the threshold is not met for that same report. Neither result proves future campaign delivery, purchase intent, or a universal creator quality grade. Do not create a threshold after seeing a creator’s data merely to rationalize a desired answer.
If no comparable total exists, do not fabricate bounds. The brand can still say the named listed countries appear among the report’s top rows for the named metric and dates. It cannot state their fraction of a complete audience unless the source establishes the denominator. “Top” is a rank statement, not a complete distribution. If every relevant country and a complete denominator genuinely are provided, say the narrower supported conclusion—about that metric, period and content scope—without adding a blanket claim about all future viewers.
Output: a one-sentence decision statement that distinguishes what is known, what interval remains possible, and whether the declared threshold is resolved.
Step 5: Request the smallest report that changes the decision
Tell the creator exactly what the missing report must answer. For the fictional 70% watch-time threshold, the request could be: “Could you share the same platform’s country breakdown for channel watch time, with report title, selected dates, total and any limited-data note visible? If the current view suppresses too many rows, could a longer comparable period or fewer breakdown filters show more?” YouTube’s limited-data help specifically suggests extending the period to more than 30 days or removing filters and breakdowns when data is limited. This may reveal more rows, but it is not guaranteed; the threshold is unpublished. Do not demand an account login, a creator password, or a report the platform does not provide.
If the business question is country distribution of unique viewers or subscribers, a longer watch-time Top-geographies view still answers the wrong metric. Ask whether the platform has a report with that target measure and country scope, then read its current official definition. If the creator is on another platform, copy that platform’s field labels and limitations from its own documentation; YouTube’s suppression example does not prove that Instagram, TikTok or a media-kit vendor hides the same rows for the same reason.
Match the time window and content type to the proposed work when possible. A creator with many older videos about a different product category may have a channel geography report that is truthful but weak for a new short-form campaign. Ask for a relevant slice only when the platform offers it and the creator can share it without misrepresenting a tiny, withheld or unstable sample. Sometimes the best answer is “the report cannot resolve this market question.” A sourcer can still shortlist on creative fit and request more evidence before making a geography-dependent commitment. Do not transform the unknown into a punitive geography score or a guessed fee.
The request should be proportionate and privacy-aware. Let the creator redact their account identity or unrelated metrics while preserving the metric name, window, scope, total and rows needed for the decision. Record who supplied the report and when. If the creator declines to share, write “not supplied” and decide using the evidence you actually have; do not call refusal proof of an out-of-market audience. If the report remains limited after a longer window, keep the unresolved amount and note what decision can or cannot be made.
Output: one specific evidence request and one owner/date for revisiting the market-fit question.
Step 6: Carry a truthful geography note into sourcing
Write the recommendation in the language of the report. A suitable note for the synthetic example would be: “For the supplied channel watch-time report covering [dates], 55% of watch time is observed in our listed U.S. and Canadian markets, 20% is observed in the listed U.K. row, and 25% is not assigned to a country in the supplied rows; our declared Australian market has no row. In-market watch time could be between 55% and 80% under this exact denominator. Our predeclared 70% watch-time criterion remains unresolved; request a fuller same-metric country report. No conclusion about follower or unique-viewer countries follows.”
If the unknown cannot affect the specific threshold, the note can be shorter. Name the metric and bounds anyway, then say why the decision is settled for that one question. Keep creative fit, integrity, delivery record, audience relevance, and commercial terms as their own evidence. A country table should not be asked to prove that viewers will buy, that the creator can explain the product, or that a future ad will reach the same mix. Use the vetting rubric only with its current conditional geography language; do not turn a provisional geography component into a final 100-point verdict.
Preserve the original report and the transcribed table together. If a new report arrives, do not overwrite the old one. Date the replacement, compare metric, period and filters, and explain whether changed percentages came from a genuinely different audience or simply a different report scope; a pair of screenshots alone may not distinguish those causes. Give the client the observed facts and the next evidence request rather than a falsely precise map of unseen countries.
The blank report-reading card holds source fields, visible country rows and the final decision. Its CSV starts with headers only; one row represents one visible country under a report ID, while the same report’s summary fields can be repeated for export. The known-versus-unknown map deliberately draws no colored country map. Blank space in a geographic heatmap would invite a reader to mistake an unseen row for a zero or an out-of-market country.
Common errors in top-country reports
Calling watch time “followers.” YouTube’s Audience Top-geographies definition is watch time. A creator may have 100,000 subscribers, but that number cannot be distributed by a watch-time country chart without a distinct supporting report. Preserve the actual metric label in the brief and client note.
Treating the unlisted part as foreign reach. If a brand markets in the United States, Canada and Australia but the report lists only the first two, the unlisted part could include Australia. The supplied list does not name it. Keep that amount unknown until the report establishes its countries; if every declared market already has a complete per-country row, record that narrower fact rather than using a loose upper bound.
Subtracting unlike numbers. A 1,000-view total minus 800 watch-time hours has no meaning. A channel total minus a single-video table is equally invalid. One report, one metric, one unit, one window, one scope and compatible filters are the minimum conditions for the arithmetic.
Assuming every missing row was privacy-suppressed. YouTube describes limited-data thresholds and top-results notes, but a crop, ranking limit, report design or rounding can also hide detail. Look for the actual platform note and request the uncropped report. Do not invent a suppression threshold; YouTube says it does not publish one.
Pricing or rejecting from a range that crosses the decision. An unresolved 55%–80% in-market watch-time range cannot prove a predeclared 70% condition. It is also not a purchase probability. Preserve the unknown and ask for the next useful report; do not apply an automatic outside-market discount or a final rejection to it.
Source and scope note
Primary YouTube sources checked October 29, 2026: Understand your YouTube audience for the Audience tab’s watch-time-based Top geographies and distinct viewer/view/watch-time definitions; Understand limited data in YouTube Analytics for unpublished suppression thresholds, total-versus-visible-row differences, the separate views example, and the advice to lengthen the period or remove filters. The three-bucket ledger, bounds method and 120-hour case are original editorial tools, not YouTube metrics or product features. The 120-hour case is fully synthetic; the 1,000-view example belongs to YouTube’s help page. No creator-authorized real report, account, market declaration, campaign outcome, keyword volume or ranking was verified for this draft. A reviewer should reproduce any real numbers from a permissioned source before publication.