How-To Guide
What is a good influencer engagement rate, and how is it calculated?
How influencer engagement rate is calculated by followers, reach and views, what published 2026 ranges measure, and how to compare creators fairly.
By the Superdirector editorial team. Sources read November 6, 2026.
At a glance
What is a good influencer engagement rate, and how is it calculated?
A good engagement rate beats similar-size creators on the same platform measured with the same formula. It is interactions divided by followers, reach or views, times 100, and the denominator moves the result most: one fictional Reel scores 2.6% to 7.1% across five published formulas. Quid's 2026 brand medians are 2.01% on TikTok and 0.30% on Instagram; Dash Social reports 3.8% for nano Instagram creators.
- Use views (or reach) for TikTok, Reels and Shorts; follower formulas overstate posts that travel beyond followers.
- Brand-account benchmarks are not creator benchmarks.
- Write the formula next to any minimum rate in a brief.
The short answer
A good influencer engagement rate is one that beats creators of a similar size, on the same platform, measured with the same formula. There is no single good number, because the published ranges use different formulas: the brand-account medians in Quid's 2026 report are 2.01% on TikTok and 0.30% on Instagram, Dash Social puts Instagram creators at 3.8% for nano accounts and 1.6% for macro, and Tinuiti's rule of thumb calls 1% to 3.5% average. Engagement rate is interactions divided by an audience number, and the audience number (followers, reach or views) changes the result more than anything else.
So the first question is always which formula. On the fictional Reel below, the same likes, comments, saves and shares give anything from 2.6% to 7.1% depending on the formula. Compare a creator only against benchmarks that use their formula, and prefer views or reach over followers for short-form video.
How this page was made: every formula and figure below is taken from the publisher's own page, read on November 6, 2026, with its date and method. We publish Superdirector, a tool that helps brands research and screen creators; it is not one of the benchmark sources. For the short-form creator's view of the same metric, see our engagement rate glossary entry.
How engagement rate is calculated
Every version has the same shape: count interactions, divide by an audience number, multiply by 100. What changes is which interactions you count and which audience number you divide by.
| Denominator | Who uses it | What you need | Main weakness |
|---|---|---|---|
| Followers | Quid, Dash Social, CreatorIQ, Rival IQ for public data | Public counts only | Short-form video often reaches far beyond followers |
| Reach (unique accounts that saw it) | Later and Hootsuite as their main formula; Rival IQ for private data | The creator's own Insights | Not public; you must ask the creator |
| Views | HypeAuditor for Instagram, Rival IQ for TikTok, Later for Reels | Public view counts | Repeat views from one person inflate the count |
| Impressions | Later and Hootsuite for paid content | Ad or Insights data | One person can create several impressions, so it is always higher than reach |
Rival IQ's help center shows how one tool switches denominator by platform: for public data it divides average engagement per post by followers, except on TikTok, where it divides by views. With private data it can divide by unique views instead.
The numerator differs too. HypeAuditor counts likes and comments only, because Instagram treats shares and saves as private data that only the account owner sees in full. Later adds saves and shares when it divides by reach or views. CreatorIQ counts likes, comments and shares against followers.
See how one post changes with the formula
Here is one fictional Reel: 50,000 followers, 120,000 views, a reach of 90,000, 3,000 likes, 150 comments, 400 saves and 250 shares. Each row is a formula a named publisher uses.
| Formula | Who uses it | Result for this post |
|---|---|---|
| Likes + comments ÷ followers | Classic follower formula; HypeAuditor's fallback | 6.3% |
| Likes + comments + saves ÷ followers | Later's follower formula | 7.1% |
| All four actions ÷ reach | Later and Hootsuite, by reach | 4.2% |
| All four actions ÷ views | Later for Reels, Hootsuite for TikTok | 3.2% |
| Likes + comments ÷ views | HypeAuditor's current Instagram formula | 2.6% |
The follower formulas come out highest here because the Reel reached more people than the account has followers. HypeAuditor's own explanation for switching to views says the same thing: Reels are now shown to many people who do not follow the account, which made follower-based rates hard to compare from one account to the next. Where an account has too few Reels, HypeAuditor still uses followers.
Use the downloadable calculator to run a creator's own numbers through all five formulas at once.
When enlarged, scroll horizontally to read the diagram.
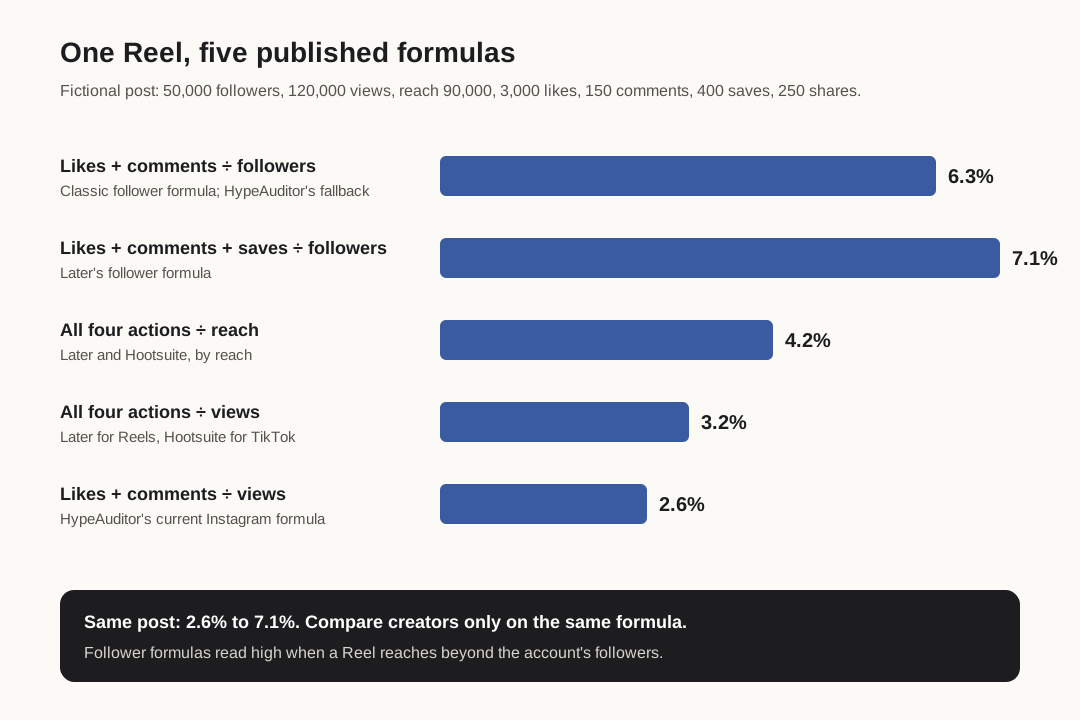
Worked example with a fictional post. Formulas as published by HypeAuditor, Later and Hootsuite, read November 6, 2026.
Illustrative worked example by Superdirector editorial team. Creation date not recorded.
Read published ranges with their method attached
These are the figures AI answers and search results most often quote for this question, with what each one actually measured.
| Source and date | What was measured | Formula | Figures |
|---|---|---|---|
| Quid 2026 Social Media Industry Benchmark Report, March 5, 2026 | 150 companies picked at random from each industry | Interactions ÷ followers | TikTok 2.01%, YouTube 0.21%, Instagram 0.30% (down from 0.36%), X 0.03% |
| Dash Social influencer benchmarks, updated March 27, 2026 | Instagram creators by follower tier | Engagement ÷ follower base | Nano 3.8%, micro 2.4%, macro 1.6%, mega 1.7% |
| Later, page updated June 25, 2026 | Over 44M Instagram feed posts, Reels excluded | By follower count | 2.88% average |
| HypeAuditor, State of Influencer Marketing 2025 | Instagram, year 2024 | As in its report | 1.59% average, down 0.26 points from 2023 |
| Nowadays, 2026 | 15,000+ creator accounts | Not tied to one of the formulas it lists | TikTok median 8% across tiers |
| Tinuiti, March 9, 2022 | Agency rule of thumb | Range not tied to the follower or reach formula the page gives | Under 1% low; 1% to 3.5% average/good |
Two things stand out. Brand accounts and creator accounts are different populations: Quid samples companies, while Dash Social's tiers are creators, so Quid's 0.30% for Instagram is not a bar for an influencer. And Later says its own follower-tier ranges are guidelines, not rules, which is the fair way to read every range in this table.
Later's guide also notes that partnerships often set a minimum of 1% to 3% depending on the industry. If you set a minimum in a brief, write down the formula beside it.
Check a creator's engagement rate before you pay
- Pick the formula first. For TikTok, Reels and Shorts, use views; Hootsuite calls views the standard approach on TikTok. Use the same formula for every creator you compare.
- Take a fixed sample. HypeAuditor's blog suggests the last 12 posts, and its help center says its reports use the latest 30. Leave out pinned posts and paid boosts if you can tell them apart.
- Calculate from public numbers: likes and comments over views. HypeAuditor notes that saves and shares are not public on Instagram, so a public-only rate will be lower than the creator's own.
- Ask the creator for Insights screenshots of reach, saves and shares on the same posts, and recalculate by reach. A big gap between their number and yours usually means a different formula, not a lie.
- Compare against creators of a similar size on the same platform, not against a brand benchmark. Rates fall as accounts grow in Dash Social's tiers, from 3.8% for nano to 1.6% for macro.
- Look at the comments, not only the rate. A rate cannot tell you whether comments are real conversation or giveaway entries.
If you are paying a fee, cost per engagement puts creators on one scale: Hootsuite's guide describes it as the fee divided by the engagements the campaign brought in. Our guides on checking an account for fake followers and average views per creator cover the next two checks.
Adjust the calculation for each platform
- Instagram: for feed posts and carousels, divide by reach if the creator shares Insights; for Reels, divide by views. HypeAuditor's public formula is likes and comments over views.
- TikTok: divide by views. Hootsuite notes that TikTok's own analytics may define engagement differently from a manual calculation, so write down which actions you counted.
- YouTube: Hootsuite says YouTube Studio does not show an engagement rate, so you add likes, comments and shares and divide by views yourself. Quid's first YouTube benchmark puts the brand-account median at 0.21%.
- Across platforms: do not compare a TikTok rate with an Instagram rate directly. In Quid's brand data the TikTok median is several times the Instagram median.
For how these numbers feed into campaign reporting, see influencer marketing metrics.