How-To Guide
How to check whether an Instagram account’s followers are real before you pay for its audience
A 45-minute, four-line check: compare engagement with three peers, sample followers and comments against a control, and ask the owner for Insights screens.
By the Superdirector editorial team. FTC, Meta, New York Attorney General and benchmark pages reviewed October 31, 2026. The worked example is fictional.
At a glance
How do you check an Instagram account for fake followers?
Build a four-line ledger in about 45 minutes. Compare the account’s median likes plus comments per follower with three similar peers. Sample 30 of its followers and 30 of the peers’ with one written rule for a thin-looking account. Count generic comments on the last 12 posts against the same count on the peers. Then ask the owner for Insights screens showing reach from followers and non-followers, follower locations, follows and unfollows, and per-post reach. Mark each line consistent, unresolved or concerning. No single line is proof, and low engagement also has real-audience causes.
- Peers are controls, not benchmarks. Published averages disagree because their samples and formulas differ.
- A follower sample under-counts bots that copy real profiles, so a clean sample is never clearance.
- Only the owner can supply reach split, locations and follows and unfollows. Ask for dates on every screen.
Direct answer
Short answer: you cannot prove from outside that an Instagram account’s followers are fake, but in about 45 minutes you can build a four-line evidence ledger that tells you whether to trust the follower count, ask for more, or plan on something smaller. The lines are engagement per follower against three similar peers, a 30-account follower sample against a matching peer sample, a tally of generic comments on the last twelve posts, and four screens from the account owner’s Insights. Each line gets one reading, consistent, unresolved or concerning, and the ledger records the source and date beside it.
This is for a marketer, agency or founder who is about to pay, gift or sign with an account and wants to know if the audience is the size it claims. The decision is narrow: what number should the plan rest on, the follower count or something smaller? The ledger does not name any follower as fake, accuse the account owner of buying followers, or tell you whether the content fits your product. Those are different questions, and a low reading has innocent explanations that the steps below keep separate.
The reason to compare instead of applying a cutoff is that published cutoffs disagree. Socialinsider’s Instagram benchmarks report an overall 0.48% average for organic posts, computed as likes plus comments divided by followers, over business accounts; the page describes the sample as 1,000 to 1 million followers in one place and says accounts above 100,000 were left out in another. Dash Social’s 2026 Instagram report shows 0.4% follower-based engagement overall. Those are different samples of business accounts, not of creators in your niche, and neither is a line below which followers are fake. Use the blank evidence ledger and the one-page map; both are blank and contain no account or result.
Why no single number settles it
Low engagement per follower has at least three common causes, and they call for different decisions. Purchased or bot followers are accounts that are not people. Real but uninterested followers can arrive through follow-for-follow loops or giveaways, or simply accumulate and go quiet. And a real, interested audience may not be shown much of what the account posts. This split is our editorial reasoning, not a sourced taxonomy. Only the first cause is what the rules below are aimed at, yet all three shrink the audience you would actually reach. So the ledger asks what number to plan on and leaves the cause open unless the evidence closes it.
Two sources explain why the checks are built as comparisons. The first is that fake accounts are built to pass a glance. When the New York Attorney General announced its settlement with Devumi on January 30, 2019, it described bot and sock-puppet accounts, some of which copied real people’s profiles, including names and pictures, without consent. The release names accounts on Twitter, YouTube, LinkedIn, SoundCloud and Pinterest and does not mention Instagram, so this shows a method and not an Instagram rate. It does show that a profile that looks like a person is weak evidence.
The second is that single rules of thumb do poorly. A peer-reviewed study of Twitter accounts, Cresci and co-authors in Decision Support Systems, reports that most of the rules proposed by the media provided unsatisfactory performance in revealing fake followers, while a classifier built on features from spam-detection research classified over 95% of its training accounts correctly. That is a different platform and a trained model, so it validates nothing on this page. It supports the design: never let one visible trait, such as a missing profile photo, carry a verdict, and read several independent lines against a control.
Line 1: compare engagement per follower with three peers
Choose three public accounts in the same niche, posting the same main format, with follower counts within roughly half to double of the account’s. That range is our rule of convenience, not a standard. Open each profile on the same day and record its follower count. Then take its last 12 feed posts, skipping pinned posts and any marked as a paid partnership, and write down likes plus comments for each. If an account hides like counts, record “hidden” and lean on lines 3 and 4 instead of guessing.
For each account, take the median of the 12 interaction counts and divide by that day’s follower count. The formula is the same likes-plus-comments-over-followers measure Socialinsider describes, except that it uses the median, so one viral post cannot carry the result. Then divide the account’s rate by the median of the three peer rates. That single number, the ratio to peers, goes in the ledger with the date.
Decide before you look what ratio will make you ask for more. A reasonable team rule is “less than half the peer median means ask”, but that is our editorial threshold, not a researched one, so change it to suit your own outcomes. A ratio above one does not clear an account, because engagement can be bought as well, but a ratio far below the peers is exactly the pattern all three causes above produce, which is why this line alone decides nothing.
Line 2: sample the followers against a control
Write the rule for a thin-looking account first. A workable one needs two conditions at once, for example the account shows no posts and has no profile photo or a username that is a name followed by a long string of digits. Requiring two conditions counts fewer real people who simply do not post, though it will still count some. This is our rule, not a platform definition, so record it in the ledger note and use it unchanged on every sample.
Open the account’s follower list and look at 30 accounts, spread through the list and not only the first screen. Note how you chose them, because the app may not show the full list or a random order of it. Then look at ten followers from each of the three peers, 30 in all, with the same rule. The peer sample is the control: a real audience will contain some accounts that match the rule, and without a control you cannot tell whether 15% is ordinary or high.
Read the result in one direction only. A much higher thin share than the control is a concern. A similar share is consistent on this line, but it does not clear the account, because the Devumi accounts described above copied real profiles, and a rule built on visible traits misses the accounts that were built to pass. Record both shares as fractions, such as 14 of 30, and never call any individual follower fake in what you share.
Line 4: ask the owner for four Insights screens
The public lines cannot show who saw the posts or where followers live. Meta’s Instagram account-insights reference documents what exists on the data side, and the app’s Insights screens are the owner’s view of the same ideas. We could not load Instagram’s Help Center pages, so we do not describe in-app menus. Ask for these, each with the date range and the date captured:
- Reach split by followers and non-followers. Meta lists a follow-type breakdown for reach with values for followers, non-followers and unknown, and notes that reach is an estimate.
- Follower locations, with ages and gender if shown. Meta’s reference says demographic metrics return only the top 45 performers and that summing the values may total less than the follower count. Record the listed total and treat the remainder as unresolved, not as foreign or fake. The partial audience geography guide shows how to write that down.
- Follows and unfollows for the same period. Meta describes this metric as accounts that followed and unfollowed in the selected period. Large movement in both directions is a question for the owner, not a verdict.
- Reach for each of the same 12 posts. This supplies the number the plan should rest on.
Meta also notes that follower demographics are not returned for accounts with fewer than 100 followers and that data may be delayed up to 48 hours, so a very small account or a screen captured moments after a spike may be incomplete. Peers’ Insights are private, so this line has no control. Compare it with the account’s own earlier periods if the owner has them, and with the public lines. A screenshot can be edited or cropped. For a larger spend, ask the owner to open Insights while you watch, or to send the same screens in two reports taken weeks apart.
Two derived numbers help. Followers reached is the period’s reach multiplied by the follower share, divided by the follower count. Working audience is the median of the 12 per-post reach values. We offer both as planning arithmetic with no sourced threshold. If the working audience is a small fraction of the follower count, plan on the working audience, whatever the cause.
When enlarged, scroll horizontally to read the diagram.
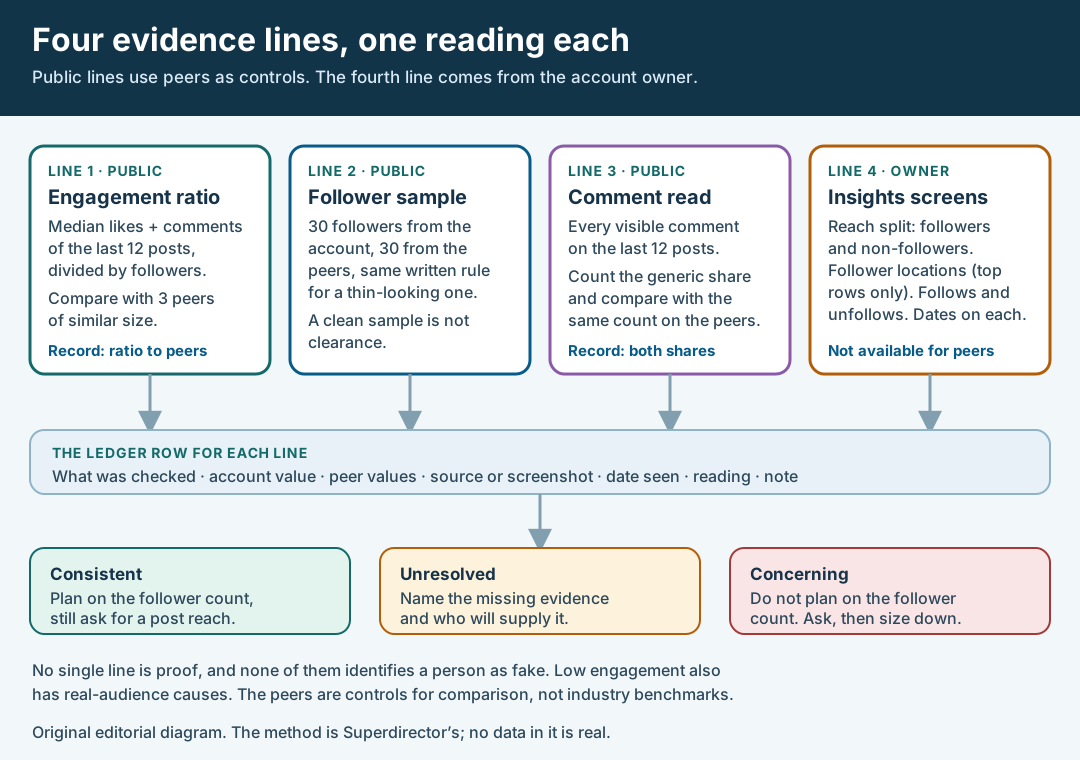
An original editorial diagram. The peers are controls for comparison, not benchmarks, and no data in it is real.
Original visual by Superdirector editorial team. Creation date not recorded.
Walk through a fictional check
Fictional exercise: the account, peers and every number are invented. No real account was inspected. A hiking-gear brand is considering Account A, with 48,000 followers. It picks peers P1 (52,000), P2 (41,000) and P3 (60,000), all in the same niche. Line 1 uses median likes plus comments on 12 posts each: A has 190, P1 1,040, P2 760 and P3 1,250.
| Line | Account A | Peers (control) | Reading |
|---|---|---|---|
| 1. Engagement ratio | 190 ÷ 48,000 = 0.40% | P1 2.00%, P2 1.85%, P3 2.08%. Peer median 2.00%. Ratio to peers 0.20 | Concerning (below the team’s half-of-peer line) |
| 2. Follower sample | 14 of 30 thin (47%) | 7 of 30 thin (23%): 2 from P1, 3 from P2, 2 from P3 | Concerning |
| 3. Comments | 62 of 140 generic (44%) | 71 of 410 generic (17%), pooled | Concerning |
| 4a. Reach split | Reach 9,400 over 30 days, 92% from followers: 8,648 followers reached, 18% of 48,000 | Not available | Unresolved: no control or history yet |
| 4b. Locations | Listed rows total 71%: Canada 21%, Brazil 18%, Indonesia 14%, other listed 18%. Unlisted 29% | Not available | Unresolved: the brand sells in Canada, the 29% is unknown |
| 4c. Follows and unfollows | 2,900 followed and 2,300 unfollowed in 30 days | Not available | Unresolved: ask what drove it |
| 5. Working audience | Median per-post reach of 12 posts: 6,200 (about 13% of followers) | Not available | Plan on 6,200 |
Three public lines point the same way, and none of the owner’s screens contradicts them. The brand still does not conclude that A bought followers. A giveaway, a follow-for-follow loop and an old, quiet audience would each produce a similar table. It asks the owner how the account grew, asks to see Insights live, and sizes the plan on 6,200 people per post, not 48,000. If the owner’s answers or a second month of screens change the picture, the readings change too. The scenario predicts nothing about any real account.
Give each line a reading and decide
| Reading | Meaning | What to do next |
|---|---|---|
| Consistent | The account’s value sits close to the control, or the owner’s screens agree with the public lines | Plan on the follower count only after you have the per-post reach, since consistent is not the same as cleared |
| Unresolved | The evidence is missing, partial or has no control | Name the missing evidence, who will supply it and by when. Do not fill the gap with a guess |
| Concerning | The value is far from the control or the owner’s screens contradict the public lines | Do not plan on the follower count. Ask the owner for an explanation and live Insights, then size on working audience or decline |
Write the reading, the evidence and the date in one place, and keep the decision separate from the reading. A team can reasonably say “concerning, but we will run one small paid test sized on the working audience”, or “consistent, and still ask for post reach”. What it should not do is round an unresolved line up to consistent because the deadline is close. The 100-point vetting rubric is the place to fold this result into a wider score that also covers content quality and brand safety.
What the rules say, and how to word the result
Meta’s Community Standards on spam list “selling, buying, or exchanging for engagement, such as likes, shares, views, follows, clicks” among prohibited conduct. The page refers to “our platforms” and does not itself name Instagram, so read it as Meta’s policy, and check Instagram’s own current rules before telling anyone their account is in breach. The enforcement result for any given account is Meta’s decision and not something this check can show.
In the United States, the FTC’s Q&A on its Consumer Reviews and Testimonials Rule says the rule took effect on October 21, 2024. Its fake-indicator provision defines fake indicators as those generated by bots, tied to accounts not associated with a real individual, or that otherwise do not reflect a real individual’s or entity’s activities. The FTC says a business is liable for buying them only if it knew or should have known they were fake, and that a business would not be liable just for hiring influencers who happen to have fake followers. That is staff guidance and not legal advice. The practical point for this check is narrow: a dated ledger shows what you looked at and when, which helps if red flags exist, but it is not a safe harbor.
Word every finding as an observation about an account and a number, such as “14 of 30 sampled followers met our thin-account rule, against 7 of 30 for the peers”. Avoid “fake”, “bought” or “fraud” about a named person. Evidence like this supports a decision to ask or to size down. It is not enough to publicly accuse anyone.
Where this check stops, and where Superdirector fits
This page checks whether the audience is real and how large to plan it. It does not judge content fit, brand safety or price. The vetting rubric scores five signals together, the authenticity score glossary entry defines the term, and the partial geography guide covers location tables in depth. If you need audits at volume, dedicated audience-analytics vendors exist, and the HypeAuditor alternatives page compares what they offer. We did not test any of them for this article.
Superdirector is not a follower-audit service, and nothing here claims it can tell you which followers are fake. What its creator shortlists do state is that inferred geography only ranks creators and never clears spend, and that fit to the brand’s declared target market remains unverified. This ledger is one manual way to do the verification those lines call for before outreach.
Limits of the evidence: the peer sample, the thin-account rule and the half-of-peer threshold are our editorial choices and have not been validated against labelled Instagram data. The Devumi and Cresci sources concern other platforms. We could not load Instagram’s Help Center, so nothing here describes in-app steps or Instagram’s own policy text. Benchmarks vary by sample and formula, and we claim no rate of fake followers on Instagram.
Line 3: read the comments, then count the generic ones
Open the last 12 posts on the account and read every visible comment. Classify each as generic or not with one written rule, for example: only emoji, a one-to-three-word remark that could sit under any post, such as “nice” or “love this”, or text repeated word for word across posts. Count generic comments, total comments, and how many of the commenters would be thin under your line-2 rule. Do the same for the three peers and pool them, so the control is a single share.
Generic comments are normal in a real audience, so the comparison is the evidence. Also note what is not generic: commenters who refer to something specific in the post, who ask a question the account answers, or who disagree. Check whether the owner replies to anyone. A comment section with a few hundred polite emoji and no one ever answering is a different picture from the same count with real exchanges, and the ledger note is where that difference goes.