How-To Guide
Which social media KPIs should a founder track, and which are vanity numbers?
Five social media KPIs a founder should track, which numbers are vanity, the formulas, and a weekly sheet, using Instagram, X and YouTube's own documents.
By the Superdirector editorial team. Instagram, X, YouTube and Google Analytics documents and the guides cited were read November 6, 2026.
At a glance
Which social media KPIs should a founder track, and which are vanity numbers?
Track five numbers: reach per post against the median of your previous ten posts, shares and saves for every 1,000 accounts reached, profile visits and follows per post, clicks from UTM-tagged links, and the signups those clicks bring. Total followers, likes, raw impressions and an averaged engagement rate are vanity numbers on their own: they grow without showing new reach or buying intent. X's published weights put a copied-link share far above a like, and Instagram's ranking explainer counts shares among the reactions it predicts for Feed, Explore and Reels.
- Divide every count by reach and compare with your own median, not a benchmark.
- X's weights file weights a like at 0.708, far below a link-copy share at 20.0.
- Tag every link with source, medium and campaign values, one lowercase source per platform.
The five social media KPIs a founder should track
A founder should track five social media KPIs: reach per post relative to your typical post, shares and saves for every 1,000 accounts reached, profile visits and follows per post, link clicks from tagged links, and the signups or sales those clicks bring. Total followers, likes, raw impressions and an averaged engagement rate are vanity numbers on their own, because they rise without telling you whether a post found new people or moved anyone toward buying. Read every number per post, divided by reach, and against your own recent posts, not someone else's benchmark.
The platforms' own documents explain why these five. Instagram's ranking explainer (Adam Mosseri, May 31, 2023) says Feed weighs five predicted reactions most: stopping on the post for a few seconds, a comment, a like, a share and a tap on the profile photo. Explore leans hardest on likes, saves and shares, and Reels on reshares and full watches. In X's weights file, mirrored from feature-switch defaults and last synced November 5, 2026, copying a post's link to share it carries a weight of 20.0, sending it by direct message 5.0 and following the author 4.0, while a like is weighted 0.708. Our reading: on X a like is the lightest of those signals, and Instagram lists it as one reaction among several, so a like count alone tells a founder little.
Vanity numbers, and what they cannot tell you
Vendor guides agree on the problem; Emplifi says many teams still defend their work with vanity numbers. The useful question for each number is what it cannot tell you.
| Vanity number | Why it misleads on its own | Read this instead |
|---|---|---|
| Total followers | Can be pushed up with giveaways and follow-backs; says nothing about who saw a post | Follows per post, per 1,000 reached |
| Likes | The cheapest action; X gives a like 0.708 and a link-copy share 20.0 | Shares and saves per 1,000 reached |
| Total impressions | One big post or repeat views inflate it; no denominator | Reach per post against your median |
| Engagement rate, averaged | An average hides which post types work and divides by followers, not reach | Per-post ratios, sorted by post type |
| Views on a viral outlier | One outlier can be a different audience that never buys | Profile visits and signups from that post |
These numbers are not useless. Follower count matters for creator deals and social proof, and likes are a fast read on a draft. They just cannot answer the founder's question: is social bringing in people who might buy?
When enlarged, scroll horizontally to read the diagram.
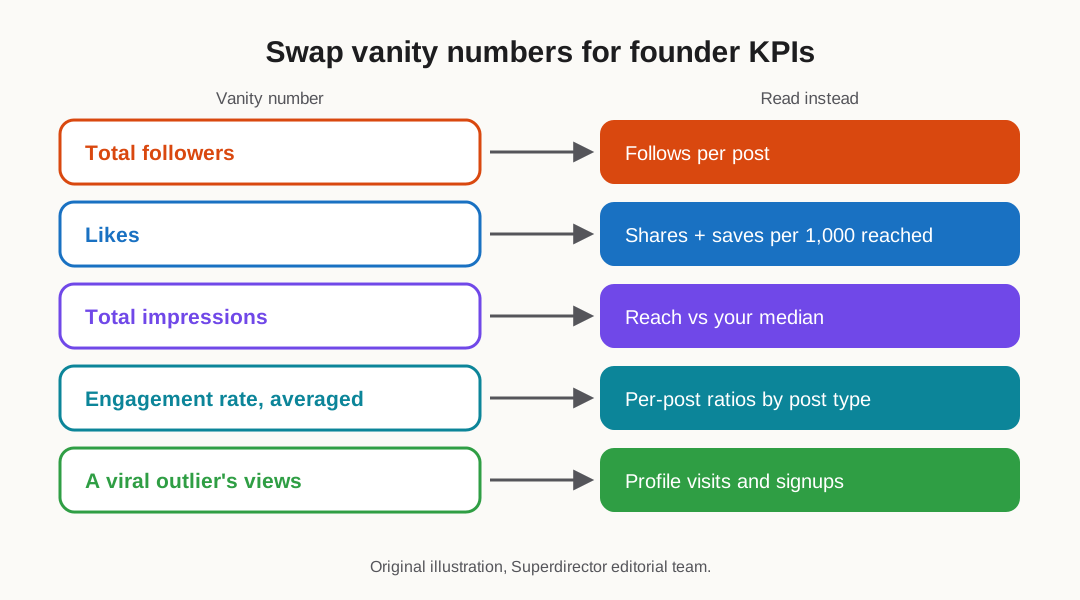
Original illustration of the swaps in this guide; thresholds in the article are our rules of thumb, not platform rules.
Original visual by Superdirector editorial team. Creation date not recorded.
Compare reach per post with your own median
Reach per post only means something next to your own normal. List the reach of your ten newest posts on one platform, take the median, and divide each new post's reach by it. A post at 2.0 or more reached twice your normal; one below 0.5 missed. These thresholds are ours, not a platform's. Read each post at one fixed age, say 48 hours; X's For You README removes posts more than 48 hours old in a filter that runs ahead of scoring, so that window fits there.
YouTube's own help supports comparing against yourself. Its impressions and CTR page says half of all channels and videos have an impressions click-through rate between 2% and 10%, warns that small videos often show higher CTR because a narrower, loyal audience saw them, and advises comparing CTRs between your own videos over the long term and not checking CTR right after upload.
Track profile visits and follows per post
Profile visits and follows per post tell you whether a post builds an audience. Instagram's explainer counts a tap on the profile photo among Feed's five main predicted reactions, and X weights following the author at 4.0. A post with high reach and almost no profile visits entertained strangers who left; a modest post that brings, say, 15 profile visits per 1,000 reached (an illustration, not a benchmark) and a handful of follows is the kind to repeat.
Keep your profile ready for those visits: one line on who it is for, a pinned post that shows the product working, and one link.
Tag every link and count the clicks
Platform link-click counts stop at the platform. To follow a click past it, tag every link you post with UTM parameters. Google's URL builder help says to always include the three tags utm_source, utm_campaign and utm_medium, to use one source value per platform (for example instagram, x, tiktok), and warns that capitalization creates different values: Meta and meta show up as two sources. The tagged visits then appear in Google Analytics' Traffic acquisition report.
| Where the link sits | utm_source | utm_medium | utm_campaign |
|---|---|---|---|
| Instagram bio link | organic_social | bio | |
| X post about a launch | x | organic_social | launch_nov |
| YouTube video description | youtube | organic_social | video_slug |
| TikTok bio link | tiktok | organic_social | bio |
Keep it all lowercase and write the values down once; the weekly sheet has a column for each post's tagged link. Creator campaigns use the same method, as our UTM walkthrough for creator campaigns explains.
Tie signups to social in your own analytics
The KPI that pays is signups, trials or orders that arrive from tagged social links. In your analytics, filter conversions by session source and campaign, and count them per week per platform. Expect the number to be small and noisy at first; ten signups in a month from one platform is a signal worth more than 50,000 impressions.
Some buyers will see a post, then search for you a week later, and arrive untagged. Ask "Where did you first hear about us?" at signup and count the social answers next to the tagged clicks. The two together are an honest range.
Review the five numbers every week
Put the five numbers in one sheet and review it every Friday for fifteen minutes. Each row is a post; the columns are its type, reach, reach divided by your median, shares and saves per 1,000, profile visits per 1,000, follows, tagged clicks and signups. Sort by the median ratio, repeat post types that clear 2.0 twice in a row, and drop a type after three posts under 0.5.
| KPI | Formula | Healthy sign (our rule of thumb) |
|---|---|---|
| Reach vs median | post reach / median reach of last 10 posts | 2.0 or more on your best post type |
| Shares and saves per 1,000 | (shares + sends + saves) / reach x 1,000 | Rising month over month |
| Profile visits per 1,000 | profile visits / reach x 1,000 | Higher on posts that mention the product |
| Tagged link clicks | sessions from your UTM links | Clicks from more than one post type |
| Social signups | conversions with a social source, plus survey answers | Any steady weekly number |
The founder KPI sheet has these columns and the formulas. For the routine the sheet measures, read our notes on deciding what to hand to AI.
What Superdirector does and does not measure
Superdirector (our product) sits on the making side of this sheet. It watches the competitors, accounts and keywords you list on Instagram, X, TikTok or YouTube, picks the posts and formats taking off, rebuilds those formats for your brand, and on the $199 Growth plan can publish Instagram carousels and single X text posts, after your first approval or with Auto-post. Its reports keep each account's sources and results together. Signups and revenue stay in your own analytics and UTM tags; Superdirector does not measure them. Its headline reads "Autonomous social media growth.*", and the asterisk says "AI video and full autopilot are coming soon."