How-To Guide
How do you track follower growth weekly, and what counts as healthy?
Record follower totals, net change and rate over consistent seven-day windows. Read the trend alongside content and audience-quality signals.
By the Superdirector editorial team. Platform and product information checked against supplied sources dated November 9, 2026. Worked example is hypothetical.
At a glance
How do you track follower growth weekly, and what counts as healthy?
Choose a consistent weekly check-in, record the account total for the same seven-day interval, and calculate net change and rate. Then interpret that line with content and audience context. Healthy is specific to your business goal; the available sources do not establish a universal weekly rate.
- Net change = ending followers − starting followers.
- Weekly rate = net change ÷ starting followers × 100.
- Track audience relevance and business signals alongside the total.
The weekly method: compare like with like
Compare account-level totals at the boundaries of the same seven-day window. Net change = ending total − starting total; weekly rate = net change ÷ starting total × 100. Keep the raw change beside the rate, since a small number of follows or unfollows can move a small account’s percentage sharply.
There is no sourced universal weekly rate that defines a healthy account. A useful reading combines direction over several weeks, whether the people finding you are relevant to the business, and whether social activity supports a goal such as product discovery, inquiries or repeat attention. Follower growth is one signal, not proof of audience quality, content effectiveness or business impact.
Use platform reporting as context, not as a substitute for a consistent log. Instagram's help explains that Insights can show new followers and content metrics over preset or custom date ranges, subject to account and feature eligibility. YouTube Studio offers growth over time, and its help notes that reported totals may be corrected, including when spam or closed accounts are removed. Keep the platform and date range in your notes so later comparisons remain interpretable.
Choose a consistent weekly check-in
Choose a recurring check-in time and log the platform, account, start and end dates, and account-level totals. Compare only matching seven-day windows; if you use different reporting views, note the difference.
If the platform provides gains and losses for that period, record them in separate columns. They help explain movement, but do not assume every screen uses identical timing or definitions. If the platform does not provide those figures, the start and end totals still let you calculate net change. You can also note campaign dates, unusual posts, collaborations or account changes; these are clues for investigation, not automatic explanations.
| Weekly field | What to record | Why it helps |
|---|---|---|
| Platform and window | Account, check-in date and seven-day dates | Keeps the comparison consistent |
| Starting and ending total | Account-level follower count at each boundary | Provides the net-change calculation |
| Gains and losses | Platform-reported figures, when available | Adds context to net movement |
| Content and context | Notable posts, campaigns or changes | Gives you something specific to investigate |
| Quality signal | One relevant audience or business indicator | Keeps growth tied to the goal |
Read the trend with a worked example
The following is a hypothetical example, created to show the arithmetic—not a customer result or benchmark. Imagine a small home-goods brand checking its account weekly. It starts one interval with 800 followers and ends with 812. Its net change is 12, and its weekly rate is 12 ÷ 800 × 100 = 1.5%. In the next interval it starts at 812 and ends at 814: net change is 2 and the rate is about 0.25%.
| Hypothetical interval | Start | End | Net change | Weekly rate |
|---|---|---|---|---|
| A | 800 | 812 | +12 | 1.5% |
| B | 812 | 814 | +2 | about 0.25% |
| C | 814 | 810 | −4 | about −0.49% |
The first interval looks stronger than the second, while the third is a net decline. That is a prompt to inspect the dates, not a verdict about the account. The owner might check whether a post reached new people, whether a campaign ended, or whether the account changed its topic or publishing pattern. If Instagram is the platform, its Insights help describes account and individual-content views, including new followers and custom reporting periods; use available views to compare context for the relevant dates.
Add one short note to the log, such as “new product guide shared” or “campaign ended.” Do not attribute the change to that event unless other evidence supports the connection. For YouTube, the Content report can show subscribers gained by content type, which gives a more focused line of inquiry than the channel total alone. Other platforms may offer different breakdowns; do not assume equivalent reports exist.
When enlarged, scroll horizontally to read the diagram.
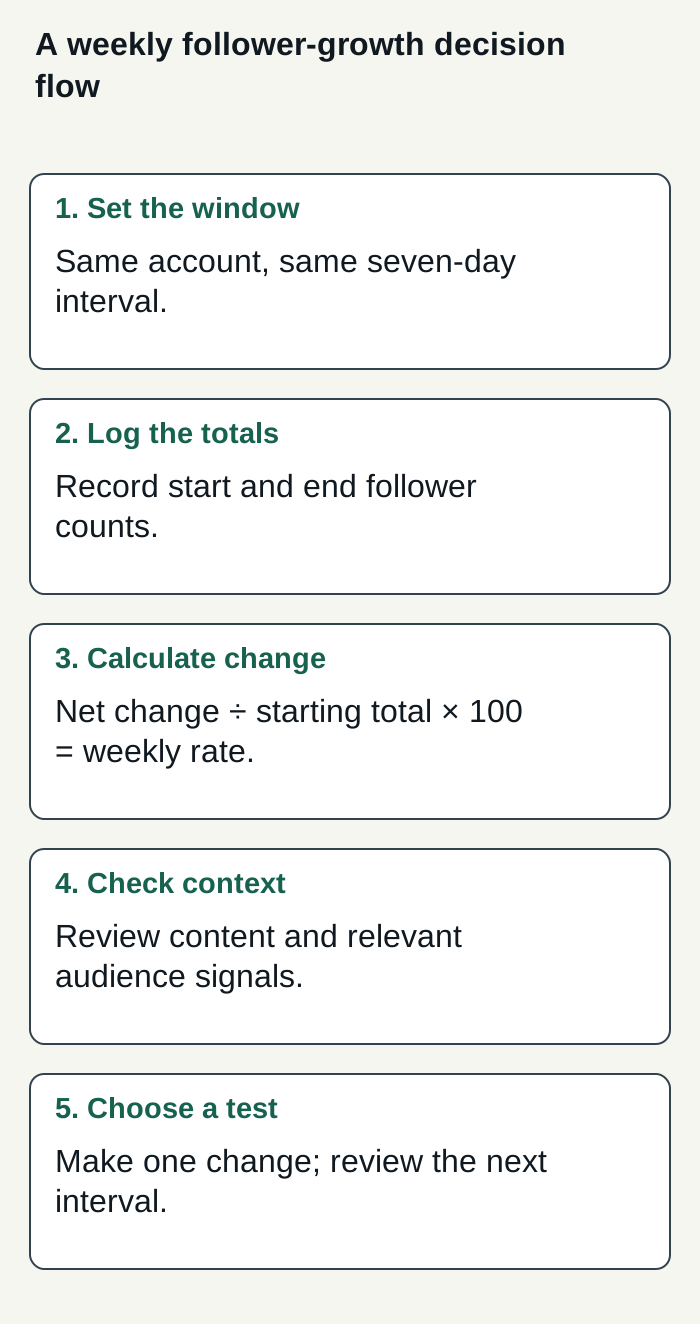
Decision flow for the hypothetical follower-growth example; account and figures are illustrative.
Condensed original editorial illustration. Read the surrounding guidance for qualifications and the complete procedure; any example is fictional and shows no verified customer outcome or product screen.
Illustrative worked example by Superdirector editorial team. Created 2026-11-09.
Judge health against your own goal
A practical weekly review asks three questions. First, what direction is the line moving across several comparable intervals? Second, are new followers plausibly part of the audience the business wants to reach? Third, is there a relevant signal beyond the count—for example, useful questions, product-page visits you already track, or inquiries? Choose a signal that fits your objective and can be observed consistently.
Treat your own past periods as the first comparison. A rolling view can reduce the temptation to react to one unusual week: compare the latest few weekly changes with the recent pattern, and inspect the underlying weeks when they differ. This is a decision aid, not a validated threshold. A flat follower line may still be acceptable if the account is serving another defined purpose; rising followers may be unhelpful if they are not relevant or do not support the goal.
Industry comparisons need care. Rival IQ's 2025 report describes median performance from a defined sample of companies and focuses on engagement and posting patterns across selected platforms. That methodology can inform like-for-like benchmarking, but it does not establish a healthy weekly follower-growth target for every account. Avoid converting a different metric or a selected industry sample into a universal rule.
Choose one next-week action
When the numbers change, first check the dates and the source. Then compare the period with what you published or changed. If one post coincides with a rise, inspect its content and available reach or follower information; treat the relationship as a hypothesis. If the line is flat, decide whether your stated goal calls for more discovery, stronger conversion from reached people, or simply a different measure of success.
Make one small, observable adjustment for the next interval and write it beside the data. For example, a home-goods brand might test whether a short set of room-layout tips attracts more relevant conversation than a product-only update. Keep other changes as steady as practical, then review the same measures next week. This will not prove causality, but it makes the next decision more informative than changing several things at once.
Use the follow conversion rate glossary if you want to distinguish audience reach from the decision to follow, and the analytics dashboard glossary for a broader view of what to collect. For broader measurement, see how to track social media ROI; for planning the content side of the test, see the weekly content plan.
Where a channel service fits
If you are considering a customizable AI-run channel at about $200 a month, decide whether delegating research, brand context, content creation and some publishing fits your follower-growth goal. Track the review and correction time it actually takes, and judge value against business signals you define—not a promised follower increase or a presumed minimal workload.
As checked November 9, 2026, Superdirector Growth is $199/month for two accounts, with no trial. It offers scheduled research, brand context and content creation; publishing is limited to eligible Instagram image carousels and single X text posts, with per-piece approval or an enabled account Auto-post rule. AI credit use varies by task. See current plan details.
Account connection and selected source cards define what can publish. Before enabling Auto-post, manually approve the account’s first post and verify it is live; then you can turn Auto-post off to stop unsent work or pause posting to hold the queue. Finished video—including TikTok, YouTube and Reels methods—is outside current publishing scope; video generation and fully autonomous channels are upcoming. See the publishing guide. Measure review effort and your own business-defined results rather than assuming either.