How-To Guide
How do you benchmark your social account against three competitors?
Compare your account with three competitors using public observations, a consistent scorecard and a test you can repeat.
By the Superdirector editorial team. Sources reviewed November 9, 2026. The worked example is hypothetical; its accounts and figures are invented.
At a glance
How do you benchmark your social account against three competitors?
Pick one business decision, one platform, and three accounts that share a relevant audience or category. Observe the same public fields over a defined period, compare only like with like, and turn a useful difference into a test. Competitors’ private analytics may not be available, so label missing data rather than treating estimates as facts.
- Choose competitors for a reason, not just because they are prominent.
- Use one platform and clearly defined measures at a time.
- Benchmarking can guide a test; it cannot establish that a competitor’s approach caused an outcome.
Start with a decision, not a leaderboard
A useful competitor benchmark starts with a question you can act on: Which post formats should we investigate? Are competitors answering a buyer question we have missed? Is our account making its offer clear? Choose one question, one platform, and three relevant accounts. Then record comparable public observations over a defined period and use them to choose one small test.
This is a practical editorial workflow, not a validated industry standard. Public posts do not reveal the whole account: reach, audience composition, paid promotion, and private interactions may be unavailable. Your goal is not to declare a winner. It is to find a plausible difference worth checking against your own account data.
Choose three accounts worth comparing
Start with the people you want to reach and the choice they face. Select accounts because they compete for a similar audience, address a similar need, or publish material your buyers might actually encounter. Write down the reason for each selection. If an account is famous but serves a different audience or business model, it may be interesting to watch but weak as a direct comparator.
- A direct alternative: a business your audience might consider instead of you.
- A close audience match: an account serving a similar customer, even if its offer differs.
- An adjacent reference: an account outside your category that communicates especially clearly about a relevant need.
These are useful selection roles, not a claim that three accounts are statistically representative. If a chosen account is inactive, has a very different audience, or uses a different account type, replace it or label the mismatch. Keep the reason in your worksheet so you remember what the comparison can—and cannot—tell you.
Set a fair observation window
Choose a start and end date before collecting posts. Use the same dates for your account and all three competitors; include enough activity to see more than a single unusual post, without pretending that one window captures a permanent strategy. Record the capture date too, since public counts can change after you look.
Make a simple sheet with one row per post and columns for account, post date, format, topic, visible interactions, visible views or impressions if provided, and a short note about the apparent purpose. Add fields for your question, time window, and capture date. Use “not visible” rather than a guessed value when a field is unavailable.
Do not treat a competitor’s public views as reach, or infer clicks, saves, retention, or audience demographics from a post’s visible reactions. Those are different measures. On YouTube, the account owner has channel and video analytics in Studio, including Advanced Mode comparisons and exports; that is a resource for your own account, not evidence that you can inspect a rival’s private analytics. YouTube also notes that some analytics data may be limited (YouTube Analytics overview).
Compare patterns and like-for-like measures
Separate what you observe from what you infer. “Three of these posts use customer questions as their opening” is an observation. “Questions caused higher reach” is a causal claim the public comparison does not establish. Note recurring topics, formats, hooks, calls to action, and visible responses, then check whether the pattern relates to your original business question.
If you calculate a rate, write its formula beside it and use the same inputs for every account. A rate based on visible interactions divided by followers is not a reach-based engagement rate. Do not combine platforms into one score, or compare reports without checking their metric definitions and populations. Buffer’s report explicitly treats its results as patterns from Buffer-connected content, not universal benchmarks, and cautions against ranking unlike measures (2026 engagement report). Its living data resource also explains that engagement-rate definitions and platform snapshots vary (Buffer data definitions).
Prefer the median of a set of comparable post-level observations when a single unusually popular post could distort the picture. State what counted as an interaction and how many posts were included. A median is a summary of the posts you collected, not a guarantee about future performance or a fair comparison if the accounts and posts differ substantially.
Work through a hypothetical bakery example
Hypothetical example: a neighborhood bakery wants to decide whether its Instagram posts explain special-order cakes clearly. It selects three fictional accounts: Cedar Crumb, a nearby bakery; Moonrise Bakes, which serves a similar local audience; and Sunday Table, a fictional café that shows its products especially clearly. The owner records a single four-week window and notes each account’s visible post format, topic, opening line, and visible interactions. These names and observations are invented, not research findings.
| Fictional account | Posts in four weeks | Visible interactions total | Mean per post | Repeated observation |
|---|---|---|---|---|
| The bakery | 12 | 120 | 120 ÷ 12 = 10 | Ordering details appear late |
| Cedar Crumb | 11 | 154 | 154 ÷ 11 = 14 | Several posts show cake interiors and serving size |
| Moonrise Bakes | 10 | 160 | 160 ÷ 10 = 16 | Captions repeatedly answer lead-time questions |
| Sunday Table | 12 | 144 | 144 ÷ 12 = 12 | Menu posts make pickup details prominent |
In this invented four-week sample, mean visible interactions per post are 10 for the bakery and 16 for Moonrise (160 ÷ 10). This descriptive mean uses visible interactions divided by posts, not reach or impressions, and does not account for promotion or audience differences; it is not a platform engagement rate. The table summarizes totals, so it cannot show post-level medians. Use a median when you have comparable post-level observations and an unusually popular post could distort the mean. The useful prompt is that comparators make lead-time answers and pickup details visible, while the bakery’s ordering details appear late. The bakery could test moving lead time and ordering instructions into the opening of a few comparable posts. For a reproducible fictional tracking method, give each test post a distinct reply phrase, such as “CAKE-A,” and give each comparable pre-test post its own phrase. Count a relevant inquiry as a unique inquiry about placing a cake order that includes that post’s phrase; apply the same rule to both sets and record post dates. Compare relevant inquiries per post, not total inquiries. Tracking phrases and exposure can differ between posts; record those differences and treat the comparison as exploratory. The figures and accounts are fictional; neither the calculation nor the proposed test predicts an outcome or proves causation.
When enlarged, scroll horizontally to read the diagram.
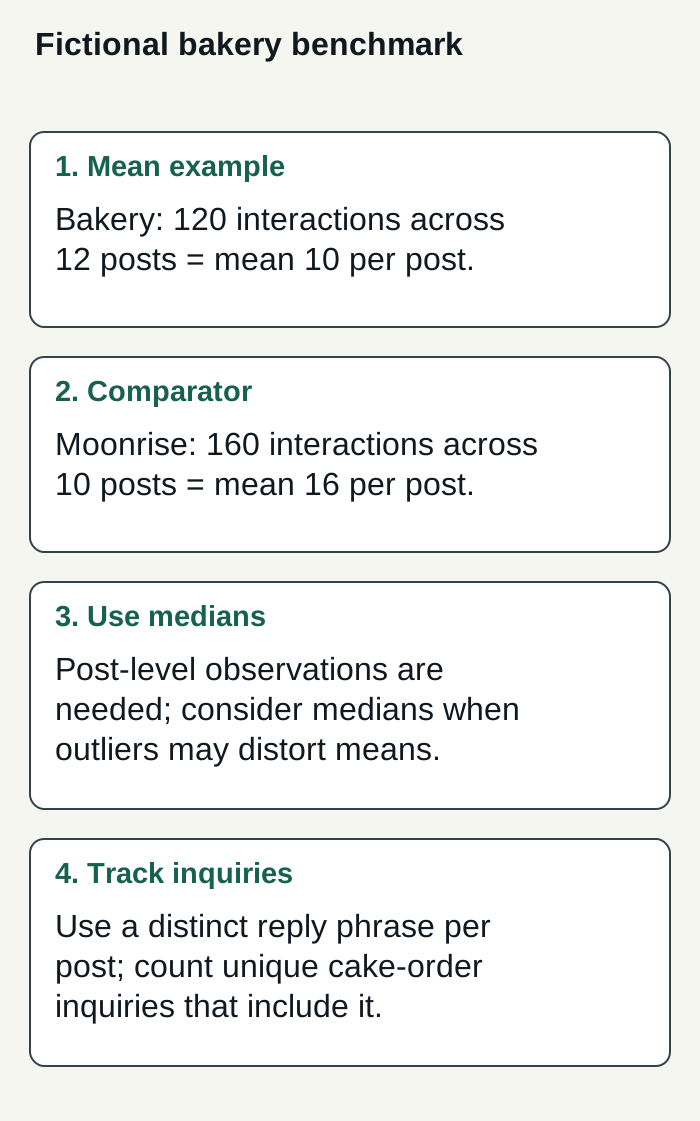
Invented figures illustrate a mean calculation and a possible tracking method, not results.
Condensed original editorial illustration. Read the surrounding guidance for qualifications and the complete procedure; any example is fictional and shows no verified customer outcome or product screen.
Original visual by Superdirector editorial team. Created 2026-11-09.
Repeat the check and judge its value
Set the repeat interval from the decision cycle and how quickly enough comparable posts accumulate. For example, if you publish weekly and are reviewing a monthly content choice, a four-week check is a practical starting point—not a universal standard. Use the same accounts, platform, fields, and definitions. If you change the selection or formula, note that openly; otherwise, apparent movement may just reflect a changed method. Compare your own account with its earlier period as well as with the competitors’ public posts, and avoid attributing a change to one content choice when other factors may have shifted.
Judge the exercise by whether it helped you choose or reject a sensible next step—not by whether it produced a dramatic-looking gap. Stop or narrow the process if data collection takes more effort than the decision warrants, or if public evidence cannot answer the question. Your native analytics can add context for your account; a spreadsheet is enough for a transparent public-post audit.
Where Superdirector fits
For a business seeking a customizable AI-run channel around $200 a month, current Growth costs $199 monthly for two accounts and has no trial (pricing). It can research, use brand context, create content, and publish eligible Instagram image carousels and single X text posts—individually approved or covered by an enabled account Auto-post rule. Finished video, including TikToks, YouTube videos, and Reels, and fully autonomous channels are upcoming, not current publishing capabilities. Whether this delegation is useful for competitor benchmarking depends on whether its research and content help you choose a test; assess the review effort and your own defined business measures rather than assuming results or minimal oversight.
Publishing depends on connecting the account and selecting source cards; these define what can be published. Before enabling Auto-post, manually approve a post and verify it appeared live on that account (how it works). Review the account and content, then judge the effort and value against the measures you define for your business.
For setup and controls, see the publishing guide. You can turn Auto-post off to stop unsent work or pause posting to hold the queue.