How-To Guide
Which carousel metrics matter: saves, shares, swipe-through or reach?
Choose metrics by your carousel's goal. Separate reach, saves and shares, and use swipe-through only when you can observe it reliably.
By the Superdirector editorial team. Revised November 9, 2026.
At a glance
Which carousel metrics matter: saves, shares, swipe-through or reach?
Use reach to understand exposure, saves for content intended to be revisited, and shares for content people may pass along. For a business objective, also measure the relevant action, such as a profile visit or attributable link click. Swipe-through is a diagnostic only when it is reliably observable; the supplied Meta documentation does not establish it as a carousel metric. Compare like with like rather than chasing a universal benchmark.
- Reach is context for interpreting response, not a complete verdict on a post.
- Meta describes aggregate and individual-post insights over selected periods, but the supplied help page does not define carousel-specific swipe-through availability.
Choose the metric that matches the post’s job
There is no universal winner among reach, saves, shares, and swipe-through. Start with the question your carousel was designed to answer. If it is meant to introduce an idea to more people, look at reach. If it teaches a process people might reuse, inspect saves. If it offers a useful point or resource people may pass along, inspect shares. If it is meant to prompt a business action, track that action too.
These are interpretations, not proof of why Instagram distributed a post or what every viewer intended. A save may mean someone wants to revisit a post; a share may suggest they found it worth passing on. Neither by itself shows that the viewer became a customer. Likewise, a large reach can mean broad exposure without showing whether the audience was relevant.
PostNitro’s practitioner guide interprets saves as potential revisit value and shares as content worth spreading. These are ways to frame questions about your post; they do not establish a causal effect for a particular account.
Use reach as context, not as the verdict
As a general working interpretation, reach indicates how many people encountered a post. Raw saves or shares can be misleading when carousels had different reach. For an account-level comparison, divide a response count by reach and label the result precisely: saves per reach, shares per reach, or link clicks per reach. These ratios are descriptive comparisons, not official Instagram success scores.
Meta says Instagram insights can be viewed at an aggregate or individual-post level for selected periods. Its current help page about viewing insights also describes views, interactions, new followers, and content shared, and says eligible Meta One subscribers can export content-level insights for reels, posts, and stories. That page does not define which carousel-specific metrics every account can see. Check your own Insights view rather than assuming a field is available.
For a post intended to lead to a business action, include an action measure that makes sense for your setup, such as a profile visit or a tracked link click. A count observed on the same day as a post is not automatically attributable to it. Note how you collected it, use consistent tracking where possible, and distinguish an observed change from a proven cause.
Treat swipe-through as a diagnostic only when observable
Be cautious with swipe-through claims. The supplied Meta help page supports general insight access but does not establish a carousel swipe-through measure or slide-level swipe reporting. A practitioner article defines swipe-through rate as viewers of the final slide divided by viewers of the first, but that formula should not be mistaken for a confirmed Meta metric (PostNitro).
If a tool or account view offers slide counts, first check what those counts mean and whether they count unique viewers, repeat views, or actual swipes. Without that definition, a ratio may be useful as a rough diagnostic but should not be reported as a measured swipe rate. Do not import a target such as a 70–80% completion figure from an unsupported practitioner benchmark.
If you cannot verify swipe data, assess the opening and flow indirectly: compare similar carousels’ saves, shares, comments, or intended actions, and note what changed in the creative. Those outcomes still do not isolate the hook’s effect, but they give you a consistent basis for learning without inventing a platform metric.
Work through a hypothetical example
Hypothetical example: a small software company posts a carousel explaining how to prepare a product launch checklist. It records 2,000 reach, 48 saves, 12 shares, and 20 profile visits. These figures are invented for illustration, not customer results or a benchmark.
| Possible goal | What to inspect | What this example can say |
|---|---|---|
| Reach new people | Reach, compared with similar posts | The post reached 2,000 accounts; one post alone does not show why. |
| Offer reusable guidance | Saves per reach: 48 ÷ 2,000 = 2.4% | The ratio describes saves relative to reach; it is not a universal target. |
| Encourage sharing | Shares per reach: 12 ÷ 2,000 = 0.6% | The ratio describes sharing relative to reach; it does not prove wider distribution. |
| Prompt profile interest | Profile visits, plus a relevant tracked next action | Twenty visits were recorded; the figure alone does not establish attribution. |
If the company’s priority was making a useful reference, saves are the most relevant of these response measures. If it wanted people to pass the checklist along, shares deserve attention. If the goal was qualified interest, profile visits are only an intermediate signal; the team should also inspect the next step it can track. Reach provides context in every case, but it does not decide whether the post met its goal.
For a repeatable comparison, write down the intended goal before publishing, use the same measurement window for similar posts, and record the denominator beside every rate. Do not compare a how-to carousel with a promotional announcement as though their jobs were identical.
When enlarged, scroll horizontally to read the diagram.
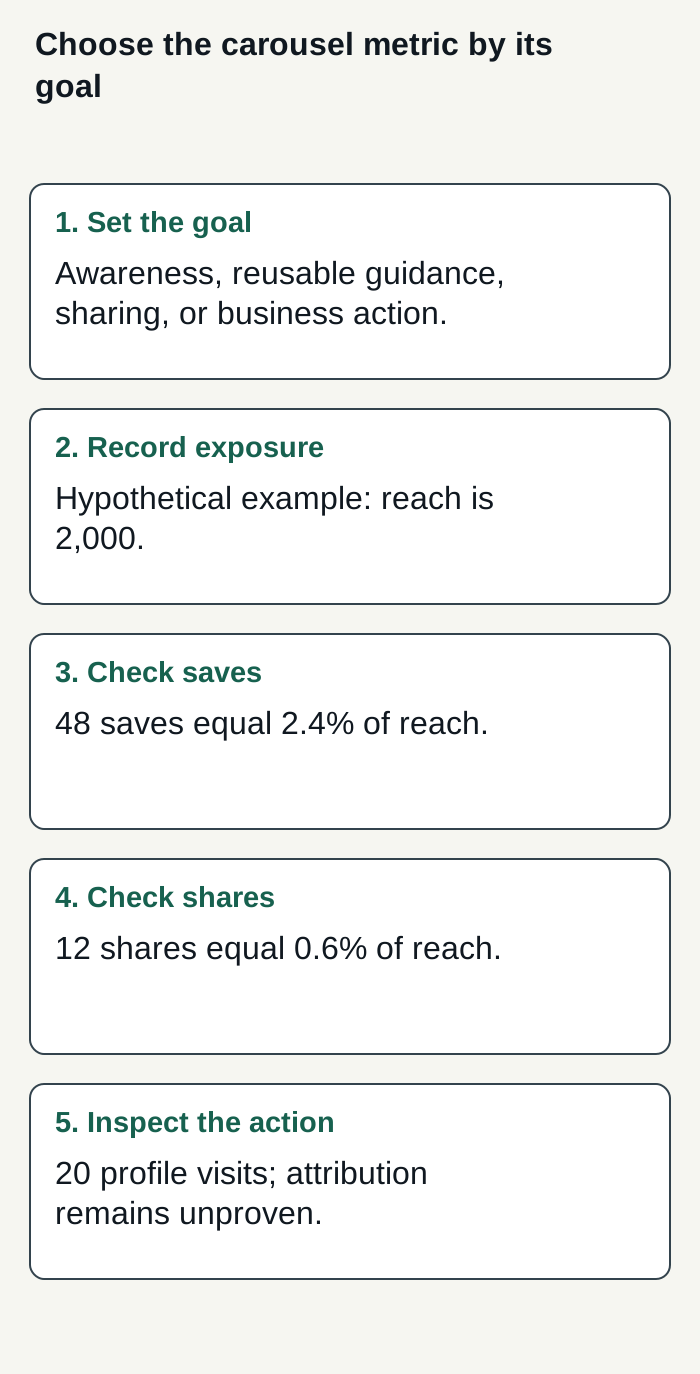
Hypothetical example only: one set of carousel counts answers different questions for different goals.
Condensed original editorial illustration. Read the surrounding guidance for qualifications and the complete procedure; any example is fictional and shows no verified customer outcome or product screen.
Illustrative worked example by Superdirector editorial team. Created 2026-11-09.
Build a small, consistent comparison log
Use a simple log rather than a composite score that hides what the post was for. For each carousel, note the date, topic, intended goal, reach, saves, shares, the relevant business action, measurement date, and any major creative change. Calculate only the rates that answer your question. A save-rate formula such as saves divided by reach is also used in practitioner guidance (AttentionClaw); treat the formula as a convenient comparison, not an Instagram-endorsed standard.
- Set one primary goal before the post goes live and name the metric that best represents it.
- Record the same fields and use a consistent observation window for posts you plan to compare.
- Compare carousels with similar purposes and audiences; note meaningful differences rather than attributing every change to one slide.
- Look for a pattern across multiple posts before revising your approach. A vendor guide recommends using historical carousel performance to set initial benchmarks, but your account’s own history is context, not a guarantee (PostNitro).
Published comparisons can provide context, but keep their scope visible. Metricool reports that its 2026 study found more saves for carousels than single-image posts across its analyzed accounts. That is a vendor-reported format comparison, not evidence that saves are the best measure for every account or that a particular carousel caused a business result (Metricool’s study release).
Decide whether a managed workflow fits
A customizable AI-run channel at about $200 a month is a buying goal to evaluate, not a currently fully autonomous service. For this carousel-metrics work, consider whether delegating relevant research, brand context, content creation, and publishing is worth the cost and review time. Growth is $199/month for two accounts, with no trial. Current publishing is limited to eligible Instagram image carousels and single X text posts, by per-post approval or an enabled account Auto-post rule; finished video—including TikTok, YouTube, and Reels video methods—and full autonomy are upcoming. Account connection and selected source cards define what can publish. Verify the first hand-approved post live before enabling Auto-post; turning it off stops unsent posts, and Pause holds the queue. See pricing and publishing documentation. Assess your own review effort and customer-defined results; neither is guaranteed.